18 EN
Chart settings
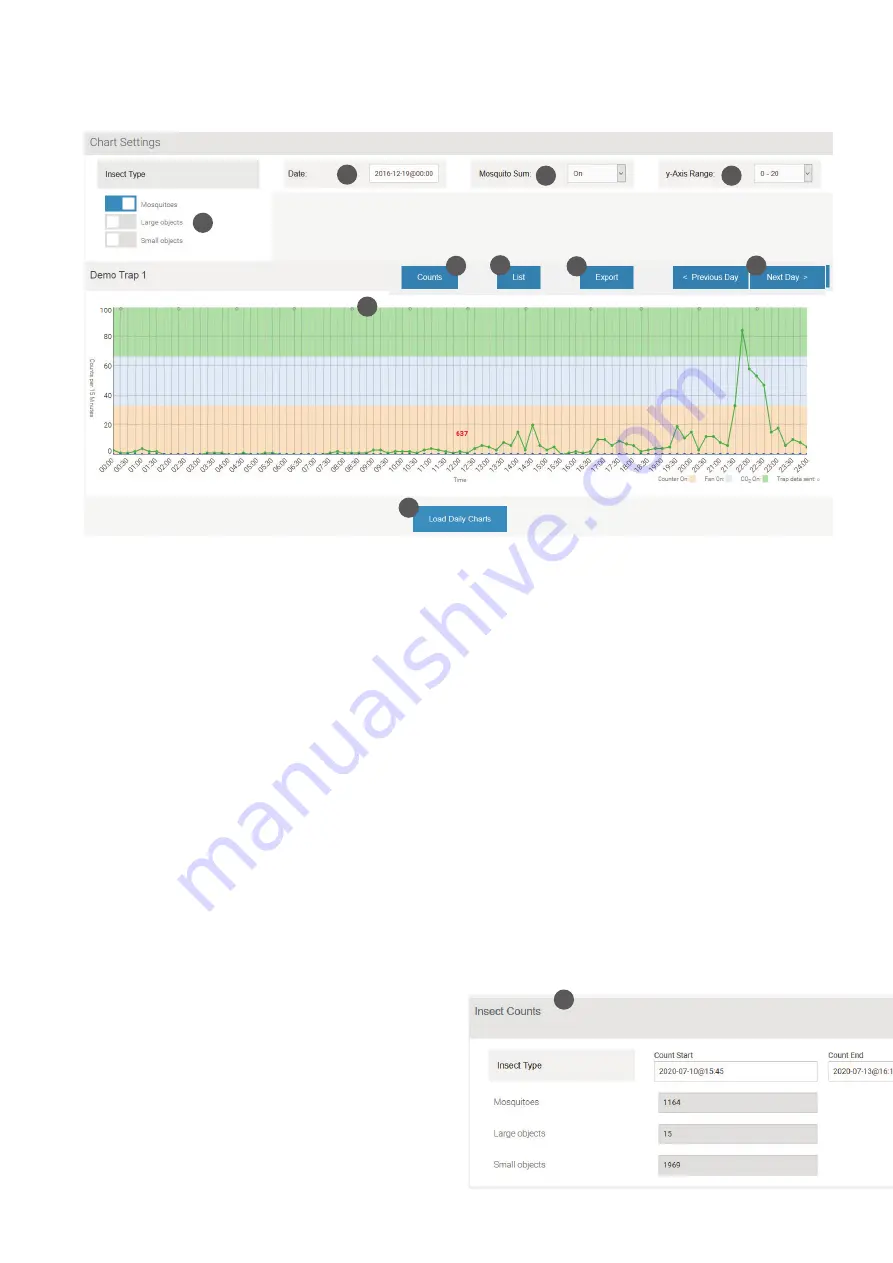
Here you can view the captures of your trap.
Exporting data into Excel
Clicking on the Export button brings up the “Export Data”
window (28). Here you can select a date range for export,
whether data are exported from 0-24 hours or 12-12 hours,
and the format of the export file (EXCEL or CSV, comma-se
-
parated values.)
Daily charts
Scroll down below today’s chart, and click on “Load Daily
Charts” to display small charts for the last 30 days (29). This
is a convenient way to spot trends.
Note: Since a large amount of data is searched, it may take
up to 20 seconds or more to update the display.
Insect counts
Clicking on the “Counts” button (30) opens the “Insect
Counts” window (31) under the main chart. Here you can
specify a time frame (with start and end date and time), du-
ring which the numbers of collected mosquitoes, large ob-
jects, and small objects will be listed. This selection does not
affect the main chart.
Accessing historical data
Data are stored and presented for 15-minute intervals. All
times are local time at the last known location of the trap.
Chart settings
In Chart Settings, you can select for display:
•
Insect Types (Mosquitoes, Large Objects, Small Objects)
(21): Press the „Insect Types“ button to see and select your
choice of insect types that will be shown in the chart.
• Date (22)
• Mosquito Sum (sum of counts for periods during which the
counter is on) (23)
• y-Axis range (24)
Main chart
When a trap is called up, today’s data are shown in the main
chart. Click on “
< Previous Day”> or >
“
Next Day >” to navi
-
gate day-by-day (25).
Color bars across the chart indicate the times during which
CO
2
, fan and counter, respectively, were turned on.
Small grey circles on top of the chart indicate the times at
which data connections took place (26).
Clicking on the chart displays the counts for the nearest
15-minute interval.
List
Click on “List” to see trap counts as well as status data dis-
played below the main chart (27). If the battery voltage is
getting low, it can be seen here. Also, the cellular reception
level is indicated; numbers of -113…-100 dB indicate a weak
signal, and data transmissions may become irregular.
21
22
23
24
26
29
25
27
28
30
31


