12 EN
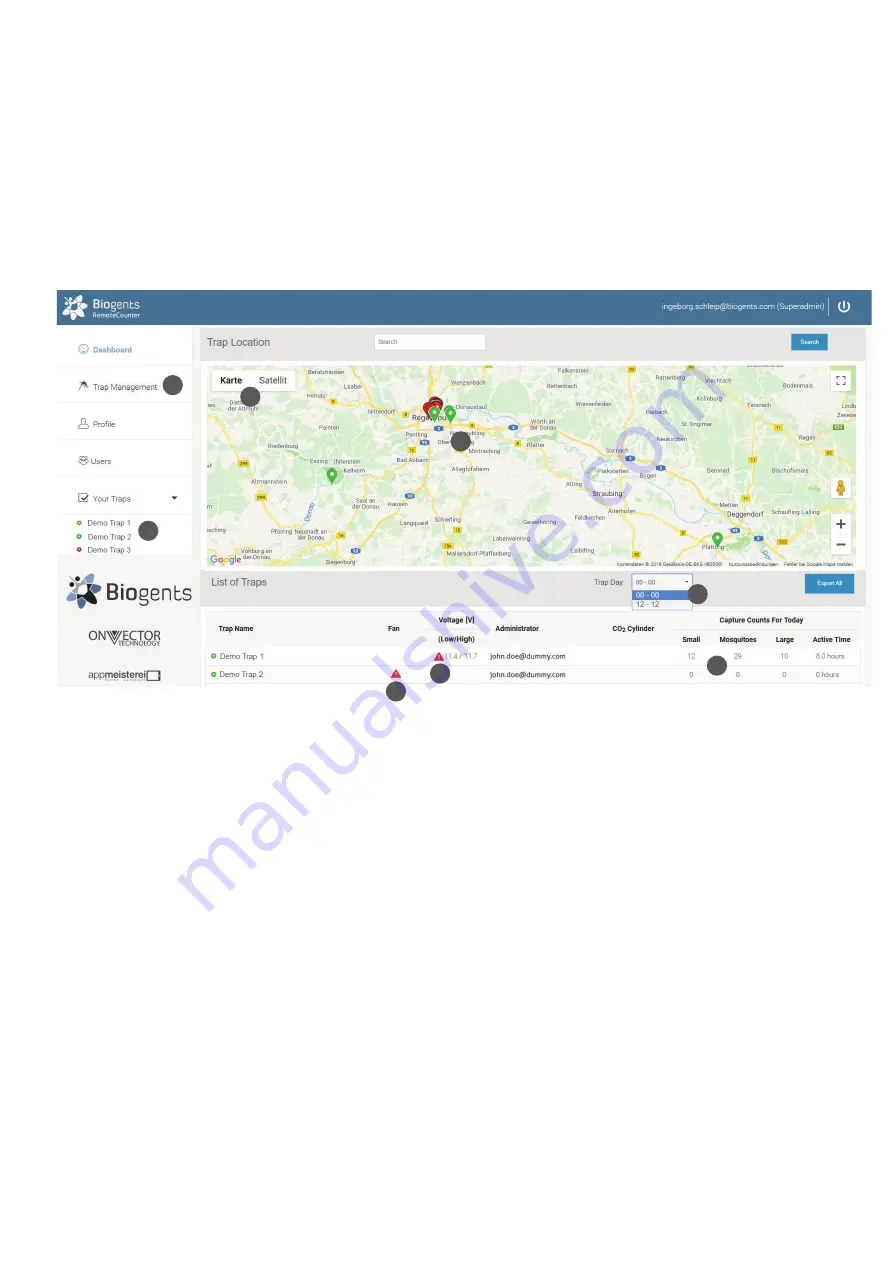
Once logged-in, the dashboard shows an overview over your traps in a map (2). When managing multiple traps, the location
display is convenient to confirm which trap is located where. That location is displayed using a label in Google Maps. You can
zoom in and out, and switch between a map display and a satellite image (3).
Active traps are shown in green, and inactive traps are shown in red.
Any devices with warning status are displayed on top of the list. Warning indicate low fan current (5) or low and high supply
voltage (6). More information on the dashboard warnings can be found on page 19 in the “Troubleshooting” section.
The traps are listed below the map in a short overview with daily captures (4).
Dashboard
• Administrators can view all traps belonging to their organisation
• Guests and operators can only see assigned traps
Viewing a trap and schedule CO
2
, fan and counter:
For each trap there is an own page with more details and the possibility to set a timer for CO
2
release and fan and counter
operation. Before you select a trap, select how you would like to have the trap day displayed on the trap page:
2
3
8
9
4
7
5
6


