P
ag
e
130
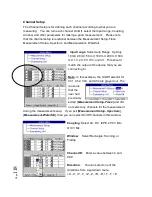
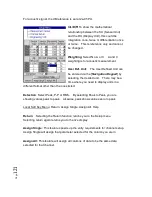
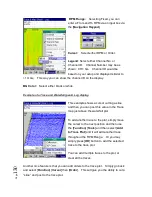
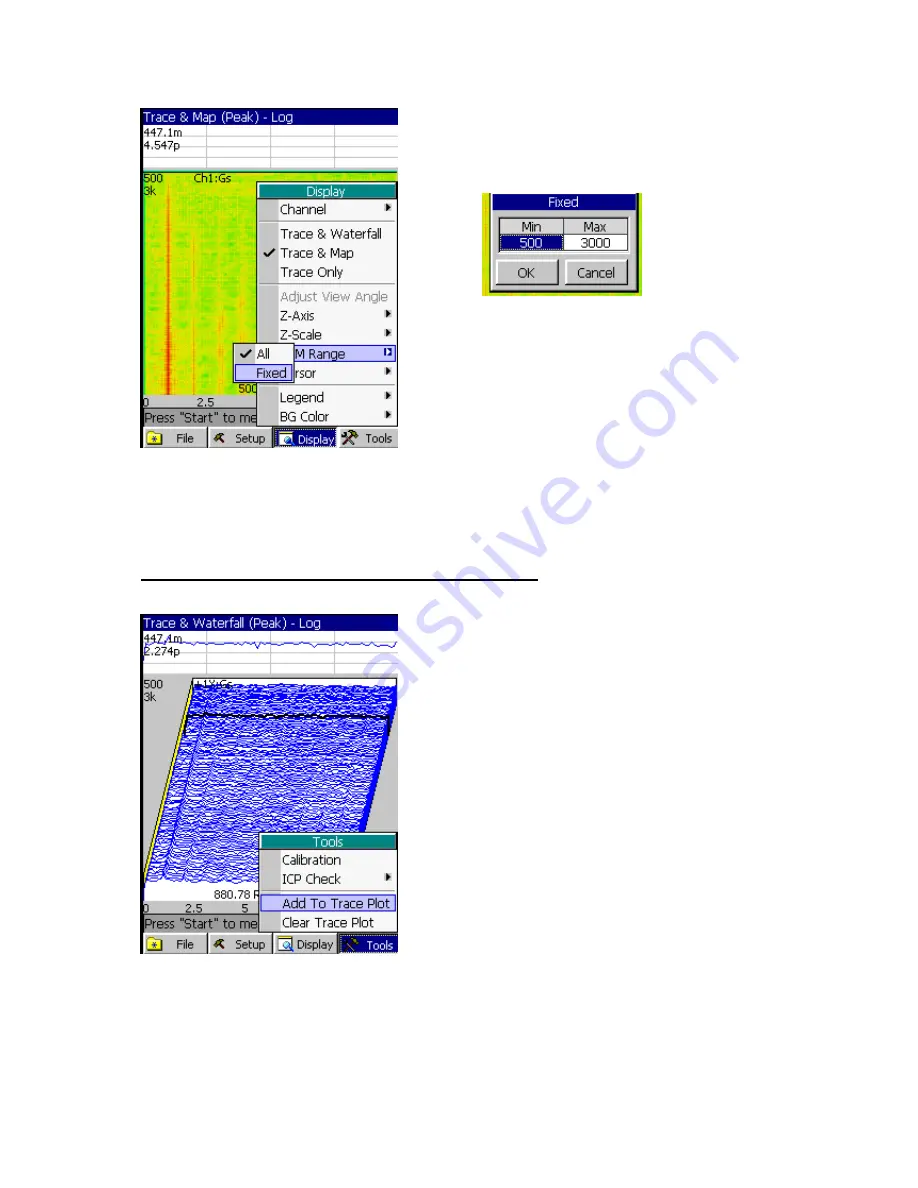
RPM Range:
Selecting Fixed, you can
enter a From and To RPM via an input box via
the [
Navigation Keypad
].
Cursor:
Select either RPM or Order.
Legend
: Select either Channel No. or
Channel ID. Channel Number may be as
shown: CH1: Gs. Channel ID would be
based on your setup and displayed similar to
+1X: Gs. This way you can show the channel ID on the display.
BG Color:
Select either black or white.
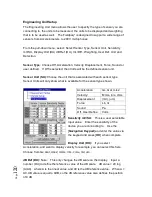
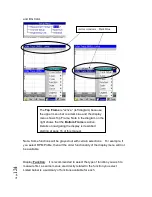
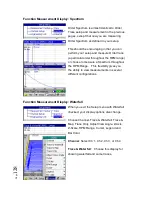
Example of a Trace and Waterfall (peak) Log display.
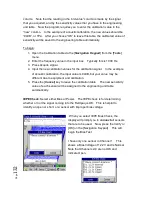
This example shows a cursor cutting a slice
and then you can post this value in the Trace
map just above the waterfall plot.
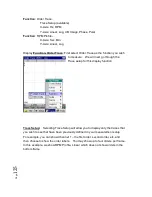
To add another trace to the plot, simply move
the cursor to the next position and then use
the [
Function
] [
Tools
] and then select [
Add
to Trace Plot
] and it will add another trace
throughout the RPM Range. Or you may
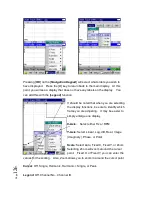
simply press [
OK
] button to add the selected
trace to the trace plot.
You can add multiple traces to the plot, or
clear all the traces.
Another nice feature is that you can add orders to the trace plot. Simply go back
and select [
Function
] [
Cursor
] then [
Order
]. This will give you the ability to cut a
“slice” and post to the trace plot.
Summary of Contents for Fieldpaq
Page 5: ...Page 4 ...
Page 54: ...Page 53 Orbit x y ...
Page 61: ...Page 60 ...
Page 104: ...Page 103 Power Spectrum Time Waveform Bearing Spectrum ...
Page 199: ...Page 198 ...
Page 200: ...Page 199 DVF specifications Maximum frequency band Maximum resolution Maximum file size ...
Page 204: ...Page 203 Done ...
Page 206: ...Page 205 5 Start the Data Explorer Program 6 Select File Import ...
Page 215: ...Page 214 ...
Page 222: ...6 ...


