background image


40 


The configurations can be saved and imported, or set to default.   

Save  the  configuration


– Tap to save the configuration values of waveforms on 

the current screen including the amplitude, the time base, the number of samples, 
etc.   

Import  the  configuration 

–  Tap  to  import  the  saved  configuration  values  of 

waveforms.  Tap  the  System  Default  Configuration  option  to  cancel  the  current 
setting values and refresh the screen to retrieve the default setting values.   


Recent  documents


–  Tap  to  open  the  recent  documents  in  order  to  view  the 

waveforms currently opened in the waveform library.   

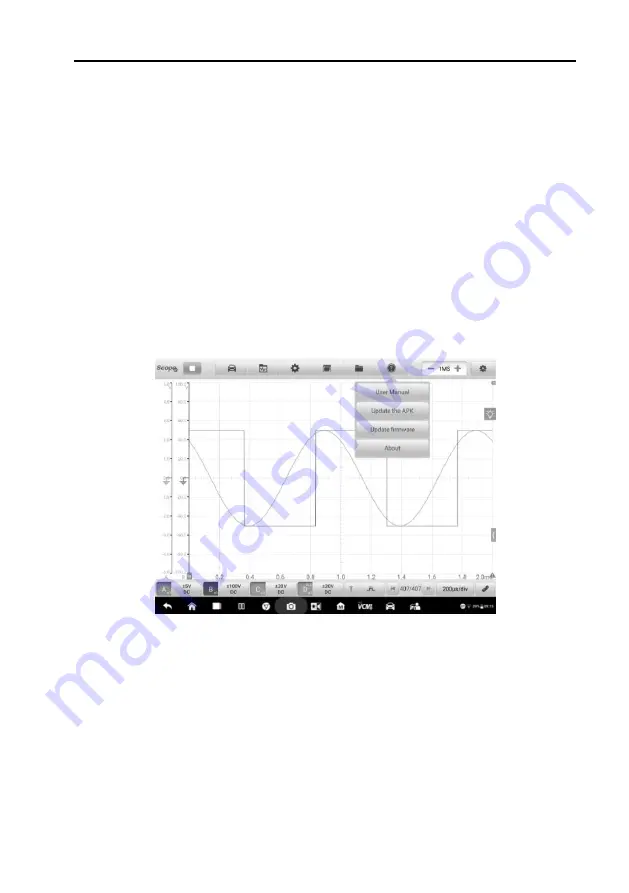
Help Menu 

The Help Menu displays the user manual, update the APK and firmware, and view 
version numbers of the installed APK and firmware. 


Figure 1-36 

Sample Help Menu Screen 

User Manual 

– 

displays instruction for the prosper use of the oscilloscope.   

Update the APK 

– 

connects to the Autel server and to check for latest application 

software. 

Update Firmware 

– 

connects to the Autel server and to check for latest firmware 

version.   

Summary of Contents for MaxiFlash VCMI

Page 1: ...d and monitored on a two dimensional grid The graphical form created by a signal is called a waveform The voltage time characteristic of the signal or waveform is drawn as a visual line called the trace 1 1 1 Safety Information Follow these instructions below to reduce the risk of injury from electric shock and prevent equipment damage A Maximum input ranges Observe all terminal ratings and warnin...

Page 2: ...lloscope ground and the point to which you intend to connect the ground input WARNING Applying a voltage to the ground input is likely to cause permanent damage to the oscilloscope the attached computer and other equipment To prevent measurement errors caused by poor grounding always use the high quality USB cable supplied with the oscilloscope or Wi Fi connection C External connections DANGER To ...

Page 3: ...cessories Internal damage will affect performance Do not block any of the instrument s air vents to avoid damage caused by overheating When cleaning the oscilloscope use wet soft cloth with mild detergent in water Do not allow water to enter the oscilloscope casing 1 1 2 General Introduction 1 1 2 1 Component Locations The input channels are located at the bottom of the VCMI device and are compati...

Page 4: ...rly connected and powered on the oscilloscope LED flashes green when operating in the oscilloscope mode VCMI Front View 1 Power LED 2 Battery LED 3 Waveform Generator LED 4 Multimeter LED 5 Oscilloscope LED 6 Vehicle LED 1 1 2 2 Technical Specifications Table 1 1 Technical Specifications Item Description Channels 4 Bandwidth 20MHz ...

Page 5: ...s Input Ranges Full Scale 50 mV to 200V Sensitivity 10 mV div to 40V div Input Coupling AC DC Input Impedance 1MΩ in parallel with 25pF Vertical Resolution 12 bits Buffer Memory 32M samples shared among active channels Time Base Ranges 100ns div to 1000s div Connection USB 2 0 Wi Fi Max Wi Fi Transmission Distance Up to 98ft DC Accuracy 1 of full scale Storage Humidity Range 5 to 95 RH non condens...

Page 6: ...access to existing automotive wiring harness connectors for obtaining signals of various sensors Four sizes are available 0 6 mm 1 5 mm 2 3 mm and 2 8 mm Flexible Back pinning Probe Red SA053 Black SA054 Designed for back probing under the insulation of multi plug terminals to detect the signal of the test component The flexible part can be bent and access to difficult areas The probe tip is not r...

Page 7: ...1V when inputting a 20V signal Battery Clip Optional Red SA061 Black SA062 Dedicated to connecting car battery terminals 65A AC DC Current Clamp Optional SA253 Used to measure AC or DC currents up to 65A Two scales are available 1mV 10mA for 10mA to 20A 1mV 100mA for 10mA to 65A 650A AC DC Current Clamp Optional SA256 Used to measure AC or DC currents up to 650A Two scales are available 1mV 100mA ...

Page 8: ...ion the VCMI device must be connected to the tablet via the provided USB cable or Wi Fi network Figure 1 1 Sample Connection Diagram To open the oscilloscope application 1 Insert the applicable test lead or probe terminal ends into the input channel s to complete the connection refer to Figure 1 1 2 Tap the Measurement icon on the Home screen of the MaxiSys Ultra Tablet The Measurement screen open...

Page 9: ...e VCMI connect successfully Please tap OK to display the actual waveform or tap Cancel to exit 1 1 4 Oscilloscope Update The operating software of the oscilloscope is continually optimized Tap the Help button in the upper half of the screen to update Before update the oscilloscope software please make sure the tablet has a stable Internet connection 1 1 4 1 APK Update NOTE The acronym APK Android ...

Page 10: ...creen 2 Tap the Update the APK in the dropdown menu A confirmation message displays Figure 1 3 Sample Update Confirmation Screen 3 Tap OK to update the software or tap Cancel to exit 1 1 4 2 Firmware Update To update the firmware ...

Page 11: ... NOTE Please DISCONNECT the MaxiScope from VCMI before updating A message displays and tap OK to confirm that you have disconnected MaxiScope from VCMI Figure 1 4 Sample Firmware Update Screen 1 3 The current version and the latest version of the OS firmware and scope firmware will display Tap Update Now to update Please do not leave the update page during upgrade It takes about 5 15 minutes for t...

Page 12: ...e grid on the screen shows divisions of voltage and time to enable measurements to be made Tap the Measurement icon on the home screen then select Oscilloscope in the menu the oscilloscope page displays The screen typically includes the following sections NOTE The Oscilloscope application can also be opened via the Android home screen Tap the Measurement icon at the top of the Android home screen ...

Page 13: ...of various settings and operations The following table provides brief descriptions of each button Table 1 2 Scope Navigation Toolbar Buttons Name Button Description Scope Icon Indicates the oscilloscope connection status See Scope Button on page 14 for more information Start Stop Start or stop the oscilloscope device See Start Stop Button on page 14 for more information Presets Access preset guide...

Page 14: ... Menu on page 38 for more information Help View the user manual update the APK oscilloscope software and firmware See Help Menu on page 40 for more information Number of Samples Set the maximum number of samples that will be captured on each channel See Number of Samples on page 41 for more information Auto Scale Set the appropriate amplitude range to display the signal correctly See Auto Scale on...

Page 15: ...ition and crankshaft position test the throttle position sensor and front oxygen sensor test Data Communication Test the vehicle communication buses including CAN bus LIN bus and K Line Engine Starting Test the functions related to car starting including starting current and voltage test Ignition Systems Test the ignition process of the vehicle including the voltage and current test of the primary...

Page 16: ...ys Tap the icon to download the preset guided information Figure 1 8 Sample Presets Menu Screen 2 4 View the preset guided information A reference signal waveform displays an injector selection is used here as an example on the Main Screen and the preset guided information on the right side of the screen ...

Page 17: ...set guided information and display the waveform Figure 1 10 Sample Reference Signal Waveform Display NOTE Parameter values such as the ranges of voltage and time divisions are automatically set for presets 6 Tap the four directional arrow icon in the lower right corner to display the ...

Page 18: ...e Start Stop button The oscilloscope will perform waveform acquisition according to the preset parameters Waveform Library Tap the waveform icon in the top navigation bar to open the Waveform Library Page The waveform library includes online waveform library and local waveform library Online Waveform Library The waveforms in the online waveform library are picked and uploaded by Autel users during...

Page 19: ...h as the vehicle model test category status etc Once you have searched a waveform you can open share the waveform code to others and follow as your favorite Figure 1 12 Sample Conditional based Search Screen 1 Model Tap the input field or the arrow icon on the right to select the vehicle model The manufacture and model should be selected from the column that displays 2 Screening conditions Three s...

Page 20: ...reference waveform for better waveform analysis Name Button Description Share Tap to display a waveform ID waveform code and you can share it through Twitter or Facebook to anyone you want Follow Tap to follow the waveform as your favorite Open Tap to open the waveform Keyword based Search On the keyword based search page please input the waveform code VIN vehicle code or screening conditions and ...

Page 21: ... the Condition based Search Keyword based Search or My Upload tab can be followed as My Favorites by tapping the five point start button The waveform can also be opened shared followed and loaded as a reference waveform Local Waveform Library The waveforms in the local waveform library are the ones saved in the tablet Input the waveform code VIN vehicle code or screening conditions and then tap th...

Page 22: ... navigation bar to open the Setting Menu The Mode Math Channels Waveform Generator Decoding Settings Startup Settings and Demo Settings can be manually configured in the menu Mode Settings Two modes and three display views are available normal mode demo mode oscilloscope view XY view and spectrum view ...

Page 23: ...e or square wave can also be displayed if you do not connect with the oscilloscope The user can use this mode to familiarize him or herself with the functions of the oscilloscope The normal mode or demo mode can be selected with any one of these three views oscilloscope view XY view spectrum view at the same time to meet different signal display needs In the Oscilloscope View the waveform shows ho...

Page 24: ...s not support the XY View and Spectrum View Please use the USB cable to connect the device instead of the Wi Fi connection The spectrum related analysis options display after selecting the spectrum view in the Mode setting screen Select the desired spectrum bins and window functions for better spectrum analysis The amplitude overrange of Y axis can be adjusted by the amplitude level When the sampl...

Page 25: ...a time limited waveform Table 1 3 Window Function Table Window Main peak width bins 3dB Highest side lobe dB Side lobe roll off dB octave Description Rectangle 0 89 13 2 6 No fading maximal sharpness used for short transients Blackman 1 68 58 18 Often used for audio work Blackman Harris 1 90 92 6 Used for general purpose Flattop 2 94 44 6 Negligible pass band ripple mainly used for calibration Gau...

Page 26: ...m unit the reference quantity used for the logarithm scale Logarithm Unit Description dBV Reference level is 1V dBu Reference level is 1mW with a load resistance of 600Ω dBm Reference level is 1mW into the specified load impedance Any dB Reference level is an arbitrary voltage X Scale the scale of the frequency axis Linear the axis is scaled in equal intervals from DC to the frequency To set the S...

Page 27: ...of built in math channels for the most important functions Turnover reverses the signal polarity to turn the waveform upside down on the screen A B channel A plus channel B A B channel A minus channel B A B multiply channel A by channel B A B channel A divided by channel B Frequency the frequency of the signal Pulse Width the positive pulse width Pulse Width the negative pulse width Duty Cycle the...

Page 28: ...navigation bar A dialog box opens 2 Select the Math Channels option in the dialog box 3 To select the Invert A tap the check box Figure 1 19 Sample Math Channel Setting Screen 1 4 Close the dialog box the waveforms are displayed on the screen Figure 1 20 Sample Math Channel Setting Screen 2 ...

Page 29: ...actuators drive Figure 1 21 Sample Waveform Generator Setting Screen To set the waveform generator 1 Tap the Settings button in the top navigation bar A dialog box opens 2 Select the Waveform Generator option in the dialog box 3 Swipe the OFF to ON to enable the waveform generator Select a desired option from the dropdown menu Tap the or buttons to adjust the voltage frequency and duty cycle value...

Page 30: ... box The waveform generator settings are displayed on the screen Figure 1 23 Sample Waveform generator Display Screen Decoding Settings When the oscilloscope mode is selected the decoding settings are available Up to 8 different protocols are supported in the decoding settings ...

Page 31: ...gnaling with signals named CAN High and CAN Low to increase noise immunity LIN Local Interconnect Network LIN is a serial protocol used in automotive electronics to allow microcontrollers to communicate with low speed peripherals FlexRay It is an automotive network communications protocol for high speed data RS232 UART Universal Asynchronous Receiver Transmitter UART is the communication interface...

Page 32: ...tate Name The name of the protocol that you have selected above The channel and the corresponding protocol name will display in the scope view after selection Display Setting You can also choose a display mode for the decoded data Hex or Binary To make the decoding settings Using CAN High as an example 1 Tap the Settings button in the top navigation bar A dialog box opens 2 Select the Mode option ...

Page 33: ...when launching the oscilloscope application On the Startup Settings screen there are three options Load the user default configuration at startup Load the previous session configuration at startup and Load the factory configuration at startup Select one option according to the specific need Figure 1 26 Sample Startup Settings Screen ...

Page 34: ...tating speed can be set by tapping the or icon to adjust the value Tap OK to confirm the settings Figure 1 27 Sample Demo Settings Screen Window Display Menu A display window with grid displays the data captured by the oscilloscope By default a single trace is displayed Additional traces can be added via the window display menu Display Mode The Window Display menu allows you to configure up to fou...

Page 35: ...mple Single Window Screen Double Window displays two separate traces horizontally one below the other Figure 1 29 Sample Double Window Screen Triple Window displays three separate traces horizontally one below the other ...

Page 36: ...wo horizontally two vertically Figure 1 31 Sample Quadruple Windows Screen To set the display mode 1 Tap the Window Display button in the top navigation bar A dialog box opens 2 Select the Display Mode in the dialog box 3 Tap the appropriate number icon to display the corresponding number of ...

Page 37: ...t which channels are visible in the display window The display status is set to ON the input channels are enabled otherwise the input channels set to OFF status are not available for viewing To set the channel setting 1 Tap the Window Display button in the top navigation bar A dialog box opens 2 Select the Channel Settings in the dialog box 3 Swipe the display status icon to ON Select the position...

Page 38: ...e the dialog box and the activated channel is displayed in the selected window Figure 1 34 Sample Channel Display Screen File Menu The File button allows you to print open save and delete the waveform data The File Menu supports the following functions ...

Page 39: ...the Save Waveform screen tap inside of each input field and enter corresponding information Tap Save or Save as default NOTE The Save option requires that you enter a file name Save as default will name the file itself Tap the Save as Text option to save the current waveform data to a text file Use the ES File Explorer app on the Android home screen to review file Home ES File Explorer Local Inter...

Page 40: ...fresh the screen to retrieve the default setting values Recent documents Tap to open the recent documents in order to view the waveforms currently opened in the waveform library Help Menu The Help Menu displays the user manual update the APK and firmware and view version numbers of the installed APK and firmware Figure 1 36 Sample Help Menu Screen User Manual displays instruction for the prosper u...

Page 41: ...ces along with digital readouts of current signal values signal status and triggering conditions can be displayed simultaneously on the main view section screen Each trace has two control features X axis and Y axis which enable you to adjust the oscilloscope settings to suit the particular test measurement If multiple traces are displayed at the same time the Y axis for each trace is adjusted sepa...

Page 42: ...ts Channel Selection In the main view section a channel has two conditions selected and unselected A channel must be selected in order for the waveform to be movement to use the zoom in or to add voltage rulers Tap the zero baseline marker or the Y axis the line thickens when selected After the channel is selected the waveform can be zoomed Tap the counterclockwise arrow button at the right corner...

Page 43: ...to exit the channel selection Figure 1 39 Sample Channel Selection 1 Unselected Waveform Zooming The zooming function allows you to change the size and position of a signal during or after capturing a waveform to examine it in greater details It does not change the stored data but the way it displays ...

Page 44: ... Ruler is generated Tap the Angle Activator in the lower right corner of the grid and drag it across the screen to the desired position An Angle Ruler is generated The two angle rulers are positioned to mark the start and end of a cycle By default the start and end angle values are 0 and 720 which can be configured in the Phase Setting box The Voltage Current Ruler can be generated in the similar ...

Page 45: ...to generate the angle rulers 2 Tap the start or end angle value to open the Phase Setting box 3 Input the desired phase value and the ruler value in the field Figure 1 41 Sample Phase Setting Screen 4 Tap Confirm in the upper right corner to save the settings or tap Cancel to exit without saving ...

Page 46: ...veform After the channel is selected the Zero Baseline can be adjusted by dragging the zero baseline marker up down along the Y axis or dragging the waveform up down or moving the screen up down in the grid Figure 1 42 Sample Dragging Zero Baseline Marker Screen Figure 1 43 Sample Dragging Waveform or Moving Screen ...

Page 47: ...parameters including sampling interval sampling rate sample size channel range and coupling mode The Help function displays the user manual of the oscilloscope The Help page also displays when selecting the Help and User Manual buttons on the upper toolbar The help information can be full page shown by tapping the four directional arrow icon in the lower right corner Figure 1 44 Sample Parameter S...

Page 48: ...tton is a bulb shaped button that can be dragged and moved on the screen Tap this real time help button to directly switch to display all the relevant introduction and test procedure information after you tap any function on the oscilloscope screen for better understanding the selected function To view the real time help information Take the Presets function as an example 1 Tap the Presets button ...

Page 49: ...down using your fingertips The real time help information can be displayed in a full screen by tapping the four directional arrow icon in the lower right corner Tap it again to recover the half screen display Figure 1 47 Sample Real time Help Screen 2 Full Screen 1 1 5 3 Lower Toolbar Buttons ...

Page 50: ...n appropriate time per division See Time Base on page 72 for more information Measurement Tap to select an appropriate measurement See Measurement on page 74 for more information Channel Control There are four input channels input channel A input channel B input channel C and input channel D The four channel buttons display on the lower left side of the screen Set the input channel s through the c...

Page 51: ...s gray Channel Color Identify each channel waveform by color Table 1 5 Channel Color Table Input Channel Color A Red B Green C Blue D Yellow The amplitude probe low pass filtering and DLC channel settings can be configured in the Channel control dialog box Amplitude Settings The amplitude settings allow you to set up the oscilloscope to capture signals with the specified range If the input signal ...

Page 52: ...AYS divided into 10 major divisions and all scale settings reflect in these 10 divisions The division set of 10 cannot be changed There are two modes available to set the amplitude value Mode 1 For example selecting DC 5V sets the channel amplitude to 5 DC displayed on the right side of the channel control button the vertical scale range is from 5V to 5V The vertical scale is divided into 10 segme...

Page 53: ...ivision For example selecting DC 1 0V div sets the channel amplitude to 1 0V div DC seen at the right side of the channel control button Each segment increases by 1V As the vertical scale is divided into 10 segments the entire vertical scale range is from 5V to 5V Figure 1 51 Sample Amplitude Setting Screen DC 1 0V div ...

Page 54: ...obes built in probes include X1 no attenuation 10 1 Attenuator select when using a 10 fold attenuation probe 20 1 Attenuator select when using a 20 fold attenuation probe SA020 X1000 select when using a 1 000 fold attenuation probe 65A Current Clamp 1mV 10mA mode Max 20A 1mV 10mA mode on 65A current clamp the max current is 20A 65A Current Clamp 1mV 100mA mode Max 65A 1mV 100mA mode on 65A current...

Page 55: ...ndard probes in the probe settings After selecting a correct probe the settings can be seen in the lower right corner of the left column of the channel control button indicating the probe is in use Tap the question mark icon to view the image of the corresponding current clamp in full screen Figure 1 53 Sample Inner Probe Setting Screen Probe Edit Add custom probes not included in the built in sta...

Page 56: ... 1 Tap the right column of the channel control button at the bottom of the screen to open the setting dialog box 2 Select the Probe Edit option in the left column of the dialog box 3 Tap each field to open the virtual keyboard and input the required information Figure 1 55 Sample Probe Edit Screen 2 ...

Page 57: ...al low pass filter for each input channel used to remove noise from the signal It is helpful to find and reject low frequencies from the selected input channel for more accurate measurements Take the two screenshots below as an example to show the comparison with or without setting the low pass filtering The following two screenshots show the difference between waveforms with the low pass filterin...

Page 58: ...tering settings 1 Tap the right column of the channel control button to open the setting dialog box 2 Select the Low pass Filtering option from the left column of the dialog box 3 Tap the checkbox of the appropriate channel and adjust frequency by tapping the minus or plus The unit can be switched to Hz KHz or MHz from the dropdown list ...

Page 59: ...e dialog box directly to exit without saving DLC Channel The DLC Data Link Connector channel enables data to be collected from the vehicle s OBDII pins for analysis of vehicle communications The DLC channel icon displays on the input channel D button Figure 1 60 Sample DLC Connection Diagram ...

Page 60: ...e the Enable DLC channel to ON Select the appropriate pins NOTE If the Enable DLC channel button CAN NOT be swiped to ON please remember to connect the VCMI power adapter and keep it charging Figure 1 61 Sample DLC Channel Setting Screen 1 4 Close the dialog box the selected result is displayed on the screen Tap the amplitude setting button at the bottom of the screen to adjust the value for the D...

Page 61: ...pe the Enable DLC channel to OFF to close the DLC channel and switch to the oscilloscope function Figure 1 63 Sample DLC Channel Setting Screen 3 Trigger The trigger feature is used to stabilize repetitive waveforms to obtain a clear signal characterization ...

Page 62: ...e is capturing the signal tap the left column of the Trigger button to activate the trigger function A trigger point displays as a blue point Figure 1 64 Sample Trigger Point Screen When the oscilloscope is capturing the signal tap the right column of the Trigger button to open the trigger settings dialog box Figure 1 65 Sample Trigger Settings Screen ...

Page 63: ...ore than or equal to 200ms div The Edge Triggering is supported in the continuous mode Trigger Mode Four trigger modes are available None Auto Repeat and Single Figure 1 66 Sample Trigger Mode Screen The table below offers brief descriptions for each trigger mode Table 1 6 Trigger Mode Table Trigger Mode Description None In this trigger mode the oscilloscope can continuously capture data without w...

Page 64: ...creen Single In this trigger mode the oscilloscope stops capturing data once a trigger event occurs Channel Select the applicable trigger channel from the dropdown menu The selected channel is the one that the oscilloscope monitors for the trigger condition Figure 1 67 Sample Trigger Channel Screen Pulse Direction Two pulse direction settings are available Rise and Fall ...

Page 65: ... trigger settings dialog box To roughly position the trigger point drag the trigger point to a desired position To configure the trigger settings 1 Tap the right column of the Trigger button to open the trigger settings dialog box 2 Select the trigger mode trigger channel and pulse direction in the dropdown list 3 Input the value in the Threshold field in the trigger settings dialog box 4 Tap OK t...

Page 66: ...is used in addition to the main trigger threshold The trigger fires only when the signal crosses the two thresholds in the correct order The first threshold arms the trigger and the second causes it to fire Figure 1 69 Sample Advanced Edge Settings Screen Window This trigger type helps to monitor when the signal enters or exits a specified voltage window Three options are available for the pulse d...

Page 67: ...n Pulse Width This trigger type allows you to monitor pulses of a specified width Figure 1 71 Sample Pulse Width Settings Screen To set the pulse width 1 Tap the Trigger button at the bottom of the screen to open the Trigger Settings dialog box ...

Page 68: ...e 1 but narrower than Time 2 Out of the time range triggers on pulses narrower than Time 1 but wider than Time 2 6 Set the trigger Threshold and Hysteresis 7 Set the Time 1 or Time 2 in minutes if available to define the pulse width 8 Tap OK to save settings or tap Cancel to exit without saving Interval This trigger type allows you to search for two consecutive edges of the same polarity separated...

Page 69: ...s an input range and stays for a specified period of time Two Region options can be selected In range and Out of range Figure 1 73 Sample Window Pulse Width Settings Screen Horizontal Distortion This trigger type helps to monitor an edge that occurs after a specified time with on edges It is useful for triggering at the end of a pulse train ...

Page 70: ...l Distortion Settings Screen Window Distortion This trigger type monitors when a signal enters a specified voltage range and stays within that range for a specified period of time Figure 1 75 Sample Window Distortion Settings Screen ...

Page 71: ... to find pulses that do not reach a valid logic level Figure 1 76 Sample Underthrow Settings Screen Buffer The waveform buffer shows which signal waveform is displayed on the current screen and how many signal waveforms are captured and stored in the buffer memory The oscilloscope can capture and store waveforms Select a waveform from the waveform buffer by tapping the Previous or Next button ...

Page 72: ...fer Index Displays the number of the waveform currently displayed onscreen out of the total number of buffered waveforms Next Tap to display the next waveform in the buffer Time Base The time base controls the time interval across the oscilloscope display Tap the Time Base button at the bottom to open the setting dialog box ...

Page 73: ...to more than or equal to 200ms div the oscilloscope switches to the continuous mode In this mode the oscilloscope updates the trace continuously as each capture progresses rather than waiting for a complete capture before updating the trace Figure 1 79 Sample Time Base Screen 2 Continuous Mode ...

Page 74: ...the waveform Frequency the number of signal occurrences per second Positive Duty Ratio the ratio of positive pulse width to period width Negative Duty Ratio the ratio of negative pulse width to period width Positive Pulse Width the amount of time that the signal spends above its average value Negative Pulse Width the amount of time that the signal spends below its average value AC RMS the root mea...

Page 75: ...p Value 90 of the waveform maximum value Bottom Value 10 of the waveform minimum value Positive Overshoot the ratio of the difference between the maximum value and the top value and the amplitude Negative Overshoot the ratio of the difference between the bottom value and the minimum value and the amplitude Positive Pre shoot the ratio of the difference between the bottom value and the minimum valu...

Page 76: ...l Power the power of the entire signal captured in the spectrum view Total Harmonic Distortion Percentage THD the ratio of the sum of harmonic powers to the power of fundamental frequency THD V1 2 V2 2 V3 2 V4 2 V5 2 Vf Total Harmonic Distortion THD dB the ratio of the sum of harmonic powers to the power of fundamental frequency THD 10log10 V1 2 V2 2 V3 2 V4 2 V5 2 Vf Total Harmonic Distortion and...

Page 77: ...Noise Ratio SNR the ratio in decibels of average signal power to average noise power SINAD 10log10 Signal Noise Inter modulation Distortion IMD a measure of distortion due to non linear mixing of two tones IMD F3 2 F4 2 F1 2 F2 2 To set the measurements 1 Tap the Measurement button at the bottom of the screen to open the measurement dialog box 2 Select the channel to be measured 3 Select the appro...

Page 78: ...creen Adjust the whole track or ruler track on the displayed screen or delete the measurement directly by tapping the X button Figure 1 83 Sample Measurement Display Screen To set the measurements in Spectrum View 1 Tap the Settings button in the top navigation bar A dialog box opens Select the Mode option in the dialog box and then tap to select Spectrum View ...

Page 79: ... open the measurement dialog box 3 Select the channel to be measured 4 Select the appropriate measurement options Figure 1 85 Sample Measurement Setting Screen Spectrum View 5 Close the dialog box and the corresponding measurement readings are displayed on the right hand side of the screen Delete the measurement ...

Page 80: ...il B If unwanted signals are displayed or signals are distorted Use only the supplied test leads or probes to connect with the input channels Check the test leads or probes for damage Ensure the polarity of the test leads connections are correct Ensure the signal and ground connections are clean and secure Ensure the ground lead is providing a direct ground from the circuit to the input channel Is...

Page 81: ...sing Amplitude The maximum voltage generated from the zero volts line of the oscilloscope Analog Bandwidth The frequency at which a displayed sine wave has half the power of the input sine wave about 71 of the amplitude Buffer Size Cache Size The size of the oscilloscope s buffer memory The buffer memory is used by the oscilloscope to temporarily store data This helps to compensate for the differe...

Page 82: ...ccurately captured by the oscilloscope Sampling Rate The number of samples per second captured by the oscilloscope The faster the sampling rate of the scope the more frequently it measures the signal voltage and so the more detailed will be the trace that appears on the scope screen ...

Page 83: ...ourself when taking electrical measurements Isolate yourself from ground by using dry rubber insulating mats to cover all exposed grounded metal Ensure all clothing including gloves are dry Stand on rubber mats when using tool Use the test leads or probes supplied with the product or proper and applicable terminals Inspect the test leads or probes for damage before use When using probes keep finge...

Page 84: ...ltimeter make sure the unit is NOT connected to a power source vehicle or computer When cleaning the multimeter use a damp soft cloth with mild detergent Do not allow water to enter the multimeter casing 1 2 2 General Introduction 1 2 2 1 Component Locations The multimeter jacks are located on the top of the VCMI device while the input channels are located at the bottom VCMI Top View 1 Multimeter ...

Page 85: ...n operating in the multimeter mode VCMI Front View 1 Power LED 2 Battery LED 3 Waveform Generator LED 4 Multimeter LED 5 Oscilloscope LED 6 Vehicle LED 1 2 2 2 Technical Specifications Item Description Voltage Range VDC 200V VAC 200V RMS Resistance Range 1Ω to 10MΩ Diode 2V Frequency Range 1Hz to 1MHz Duty Cycle Range 1 to 99 Pulse Width Range 1us to 1000ms ...

Page 86: ...se refer to Accessories on page 5 for details 65A current clamp 650A current clamp Large Dolphin Clip Small Crocodile Clip Multimeter Probe Back pinning Probe Flexible Back pinning Probe Breakout Lead Battery Clip The two multimeter test leads Red SA015 Black SA016 are standard for the multimeter and waveform generator Multimeter Test Lead Used to connect the multimeter and multimeter probe ...

Page 87: ...t icon on the Home screen of the MaxiSys Ultra Tablet The Measurement screen opens 3 Tap the Multimeter icon to open the Multimeter Menu 4 Select a test to continue NOTE Please check the multimeter LED status indicator on the front panel of VCMI device The multimeter LED lights green when operating in the multimeter mode 1 2 4 Multimeter Update The operating software of the multimeter is continual...

Page 88: ...ins all the assets of a particular app To update the APK is to install the latest version of the app on your tablet To update the APK 1 Tap the Help button on the upper half of the screen A dropdown menu displays Figure 1 2 Sample Help Screen 2 Tap the Update the APK in the dropdown menu A confirmation message displays ...

Page 89: ...s Tap the Measurement icon on the home screen then tap the Multimeter icon in the menu the multimeter page displays The screen typically includes the following button sections NOTE The Multimeter application can also be opened via the Android home screen Tap the Measurement icon at the top of the Android home screen Tap Multimeter icon ...

Page 90: ...f various settings and operations The following table provides brief descriptions of each button Table 1 1 Upper Toolbar Buttons Name Button Description Multimeter Icon Displays the multimeter connection status See Multimeter Button on page 91 for more information Start Stop Start or stop the multimeter device See Start Stop Button on page 91 for more information Display Mode Set the display mode ...

Page 91: ...tablet and the Multimeter are connected a red X means the device and the tablet are not connected Start Stop Button Press this Start Stop Button icon to start and stop the multimeter device Name Button Description Start Tap to start the multimeter Stop Tap to stop the multimeter Display Mode Menu The position of the digital readouts and waveform in the main view section can be selected in the Disp...

Page 92: ...display mode will be shown on the screen Table 1 2 Display Mode Table Icon Mode Description Digital Mode Displays the digital readouts only Waveform Mode Displays the waveform only Digital Waveform Mode Displays both the digital readouts and waveform File Menu The file menu supports the following functions ...

Page 93: ...his operation Save Waveform Tap to capture and save the current waveforms On the Save File screen tap each item to input the corresponding information and then tap Save or Save Default to finish NOTE The file name is required when saving waveforms Open Waveform Tap to retrieve the saved waveforms Tap the Edit button in the upper right corner of the screen to select and or delete the saved waveform...

Page 94: ...Help Menu The Help Menu allows you to view the user manual update the software and view versions of the device Figure 1 7 Sample Help Menu Screen User Manual displays instruction for the prosper use of the multimeter Update the APK connects to the Autel server to check for latest application software About displays the model number of the multimeter and version numbers of the installed software an...

Page 95: ...Main View Section Screen Digital Mode Current Value the current value can be the AC voltage DC voltage resistance frequency or duty cycle Maximum the recorded maximum value of the measurement Minimum the recorded minimum value of the measurement Peak to Peak the difference between the maximum and minimum values Average the average value of the measurements Waveform Mode The main view section in th...

Page 96: ... section a channel has two conditions selected and unselected A channel must be selected in order for the waveform to be movement to use the zoom in or to add voltage rulers To select and unselect the channel 1 Tap the zero baseline marker or the Y axis the line thickens when selected 2 Tap the zero baseline marker or the Y axis again to exit the channel selection Waveform Zooming The zooming func...

Page 97: ...oss the screen to the desired position A Time Ruler is generated The horizontal Y axis Ruler The Ruler can be generated in the similar way by tapping the Ruler Activator in the upper right corner and dragging it downwards NOTE The horizontal Y axis ruler varies according to the settings of the voltage current frequency duty cycle etc When Measurement Rulers are generated a Ruler Table showing time...

Page 98: ...arker to make the vertical scale line thinner In this case the waveform is unselected and cannot be dragged Tap the baseline marker again to select Figure 1 11 Sample Zero Baseline Screen Wiring Diagram and Help Tap the arrow button in the lower right corner of the screen to open the Wiring Diagram and Help window The Wiring Diagram function provides the connection diagram operation steps and oper...

Page 99: ...n and close the Wiring Diagram and Help window 1 Tap the arrow button on the right hand side of the screen Figure 1 13 Arrow Button Position Screen 2 The Wiring Diagram and Help window displays 3 Tap the arrow button again or tap any space outside of the window ...

Page 100: ... time base can be configured in the lower toolbar Table 1 3 Lower Toolbar Buttons Name Button Description Measurement Tap to select an appropriate measurement See Measurement Setting on page 101 for more information Amplitude Tap to select an appropriate amplitude value See Amplitude Setting on page 102 for more information Buffer Tap the Previous or Next button to switch to the previous or the ne...

Page 101: ... type of current clamp can be selected in the dropdown list Diode conducts the diode test of the electrical circuit Frequency measures the frequency of the input signal Duty Cycle measures the and duty of the input signal Connectivity determines whether a low impedance exists two points in the electrical circuit If the impedance is less than 100 ohms the circuit is closed otherwise the circuit is ...

Page 102: ...the right column of the dialog box The blue color indicates the option is selected Figure 1 16 Sample Measurement Setting Screen 3 Close the dialog box the measurement type you set displays on the screen Amplitude Setting Amplitude value can be configured for the selected measurement type excluding resistance measurement ...

Page 103: ...C 10V sets the amplitude to Voltage 10V displays on the amplitude button The vertical scale range is from 10V to 10V As the vertical scale is divided into 10 segments each segment increases by 2V Figure 1 17 Channel Setting Dialog Box Screen DC 10V Mode 2 Select the div button to adjust the value increments of each division For example selecting DC 2 0V div sets the amplitude to Voltage 2 0V div d...

Page 104: ...e correct points of the circuit 3 Tap the Measurement Setting button in the lower left corner of the screen to open the setting dialog box Select AC voltage in the dialog box 4 Set the proper amplitude value in the Amplitude Setting menu in the same dialog box 5 The voltage displays onscreen Note Use the optional current clamp connected to the input channel A when measuring currents Use the suppli...

Page 105: ...r left corner of the screen to open the setting dialog box 2 Select the Probe Edit option in the left column of the dialog box 3 Tap each field to open the virtual keyboard and input the required information Figure 1 20 Sample Probe Edit Screen 2 4 Tap Add to save the settings or tap Clean to exit without saving ...

Page 106: ...obe Edit Screen 3 Buffer The waveform buffer displays the number of the waveform currently displayed on screen out of the total number of stored waveforms The multimeter can capture and store up to 32 waveforms Tap the Previous or Next button to review waveforms Figure 1 22 Sample Buffer Screen ...

Page 107: ...ck if the VCMI device is properly connected to the MaxiSys Tablet via Wi Fi or the supplied USB cable If the communication between the VCMI device and the MaxiSys still fails restart the MaxiSys Tablet and reconnect the VCMI device 1 2 7 Glossary AC Alternating Current electrical current that switches polarity at regular intervals DC Direct Current electrical current that flows in one direction on...

Page 108: ...ratio of the total cycle time Peak to Peak The difference between maximum and minimum value Cursor The onscreen markers used to measure time and amplitude Diode A semiconductor device that allows current flow only in one direction Grid A network of horizontal and vertical scales displayed on the scope screen that aids in the measuring of signal characteristics ...

Page 109: ...lectric shock To avoid electric shock hazard disconnect power cable before removing covers To prevent injury or death do not use the waveform generator if it appears to be damaged in any way and stop use immediately if you are concerned any abnormal operations Inspect the test leads or probes for damage before use Use the accessories supplied with the product Use the supplied replacement fuses or ...

Page 110: ...op of the VCMI device VCMI Top View 1 Multimeter Jacks for ground and signal cables 2 USB Port 3 Hook 4 DC Power Supply Input Port 5 Power Button The waveform generator LED is located on the front panel of the VCMI device When the VCMI is properly connected and powered on the waveform generator LED lights green when operating in the waveform generator mode VCMI Front View ...

Page 111: ...le Range 1 to 99 1Hz to 30KHz 1 3 2 3 Accessories The following accessories are compatible with the waveform generator and oscilloscope Please refer to Accessories on page 5 for details Large Dolphin Clip Small Crocodile Clip Multimeter Probe Back pinning Probe Flexible Back pinning Probe Breakout Lead Battery Clip The multimeter test leads Red SA015 Black SA016 are standard for the waveform gener...

Page 112: ...information see Establish Vehicle Communication Figure 1 1 Sample Connection Diagram To open the waveform generator application 1 Insert the multimeter test lead ends into the multimeter jacks on the top of the VCMI device to compete the connection 2 Tap the Measurement icon on the Home screen of the MaxiSys Ultra Tablet The Measurement screen displays 3 Tap the Waveform generator icon to open the...

Page 113: ...p the Help button in the upper half of the screen to update 1 3 4 1 APK Update NOTE The acronym APK Android Package Kit is used on the tablet and in this manual This file contains all the assets of a particular app To update the APK is to install the latest version of the app on your tablet To update the APK 1 Tap the Help button on the upper half of the screen A dropdown menu displays Figure 1 2 ...

Page 114: ...surement icon on the home screen and select Waveform generator from the menu the waveform generator page displays The screen typically includes the following button sections NOTE The Waveform generator application can also be opened via the Android home screen Tap the Measurement icon at the top of the Android home screen Tap Waveform generator icon ...

Page 115: ...olbar buttons are used to configure settings and operations The following table provides brief descriptions of each button Table 1 1 Upper Toolbar Buttons Name Button Description Waveform generator Icon Displays the waveform generator connection status See Waveform generator Button on page 116 for more information Start Stop Start and stop the waveform generator device See Start Stop Button on pag...

Page 116: ...displays the waveform generator connection status A green check mark means the tablet and the waveform generator are connected a red X means the device and the tablet are not connected Start Stop Button You can tap the Start Stop Button icon to start or stop the waveform generator device Name Button Description Start Tap to start the waveform generator Stop Tap to stop the waveform generator File ...

Page 117: ...he corresponding information and then tap Save or Save Default to finish NOTE You must name the file to save the waveform Open Waveform Tap to retrieve the saved waveforms Tap the Edit button in the upper right corner of the screen to select and or delete the saved waveform Save as text Tap to save the current waveform data to a text file Use the ES File Explorer app on the Android home screen to ...

Page 118: ...ion The main view section screen displays as a coordinate grid with X axis and Y axis representing the duration and voltage level respectively Channel Selection In the main view section a channel has two conditions selected and unselected A channel must be selected in order for the waveform to be movement to use the zoom in or to add voltage rulers To select and unselect the channel 1 Tap the zero...

Page 119: ...istics such as amplitude at specific points and the cycle time duration The vertical Time Ruler Tap the Ruler Activator in the lower left corner of the grid and drag it across the screen to the desired position A Time Ruler is generated The horizontal Voltage Ruler The Voltage Ruler can be generated in the similar way by clicking the Ruler Activator in the upper right corner and dragging it downwa...

Page 120: ... arrow button in the lower right corner of the screen to open the Wiring Diagram and Help window The Wiring Diagram function provides the connection diagram operation steps and operation notes The Help function provides the content sensitive help displaying information relevant to the procedure operation or instructions Figure 1 8 Sample Wiring Diagram and Help Screen To open and close the Wiring ...

Page 121: ...lbar Buttons Name Button Description Signal Mode Setting Tap to select an appropriate signal mode See Signal Mode Setting on page 122 for more information Voltage Setting Tap to select an appropriate voltage value See Voltage Setting on page 126 for more information Frequency Setting Tap to select an appropriate frequency value See Frequency Setting on page 129 for more information Duty Cycle Sett...

Page 122: ...ator supports numerous signal modes including the DC voltage square wave square wave X Y triangle wave and actuators drive and arbitrary waveform Figure 1 10 Signal Mode Setting Screen DC Voltage Figure 1 11 Sample DC Voltage Connection Diagram ...

Page 123: ...ncluding the canister solenoid valve injector solenoid valve transmission hydraulic valve hydraulic control valve ignition coil idle motor and throttle motor It can change the operation speed and working time of the actuator by setting the frequency and duty cycle The higher the frequency the faster the speed and the higher the duty cycle the longer the working time and vice versa NOTE To avoid da...

Page 124: ...Square Wave Figure 1 13 Sample Square Wave Connection Diagram Once the voltage and frequency are set in the waveform generator interface the square wave signals simulate the signals of various Hall sensors Square Wave X Y Figure 1 14 Sample Square Wave X Y Connection Diagram ...

Page 125: ... signal and the Y represents the missing tooth signal The default setting is 58 2 which can be adjusted as needed Triangle Waveform Figure 1 15 Sample Triangle Waveform Connection Diagram This is a symmetrical triangular waveform which is mainly used to simulate the triangle wave signals The amplitude and frequency can be configured in this waveform ...

Page 126: ...forms can be loaded again after the waveform and parameter settings are saved Voltage Setting After you select the waveform mode you can also set the amplitude value for that mode There are three methods to adjust the voltage value Method 1 Tap the and buttons at the bottom of the screen in the Voltage Setting ...

Page 127: ...he voltage by 0 1V 1V to 12V Raises the voltage by 1V Lowers the voltage by 1V Method 2 Tap the Voltage Setting button at the bottom of the screen to open a dialog box Adjust the voltage value by tapping the positive or negative value at the bottom of the dialog box Then tap OK to confirm or Cancel to exit without saving ...

Page 128: ...age by 0 1V 0 1V Lowers the voltage by 0 1V 1 0V Raises the voltage by 1V 1 0V Lowers the voltage by 1V Method 3 Input the voltage value using the virtual keyboard Tap the voltage field to clear the current value and input the new value Tap OK to confirm or Cancel to exit without saving ...

Page 129: ... is selected and the waveform generator is operating you can also set the frequency value for that mode There are also three methods to adjust the frequency value Method 1 Tap the and buttons at the bottom of the screen in the Frequency Setting Figure 1 20 Sample Frequency Setting Screen 1 ...

Page 130: ...uency by 100Hz 1 0KHz to 30 0KHz Raises the frequency by 1KHz Lowers the frequency by 1KHz Method 2 Tap the Frequency Setting button at the bottom of the screen to open a dialog box Adjust the frequency value by tapping the positive or negative value at the bottom of the dialog box The unit of the frequency can be switched Hz to KHz Tap OK to confirm or Cancel to exit without saving Figure 1 21 Sa...

Page 131: ...ency by 1KHz 10 0KHz Raises the frequency by 10KHz 10 0KHz Lowers the frequency by 10KHz Method 3 Input the frequency value using the virtual keyboard Tap the frequency field to clear the current value and input the new value Tap OK to confirm or Cancel to exit without saving Figure 1 22 Sample Frequency Setting Screen 3 Duty Cycle Setting When the waveform mode is set you can also set the duty cy...

Page 132: ...uty Cycle Setting Screen 1 Range Button Description 1 to 99 Raises the duty cycle ratio by 1 Lowers the duty cycle ratio by 1 Method 2 Tap the Duty Cycle Setting button at the bottom of the screen to open a dialog box Adjust the duty cycle by tapping the positive or negative ratio at the bottom of the dialog box Tap OK to confirm or Cancel to exit without saving ...

Page 133: ...0 1 0 Lowers the duty cycle ratio by 1 0 10 0 Raises the duty cycle ratio by 10 10 0 Lowers the duty cycle ratio by 10 Method 3 Input the duty cycle ratio using the virtual keyboard Tap the duty cycle field to clear the current value and input the new value Tap OK to confirm or Cancel to exit without saving ...

Page 134: ...cable IMPORTANT To avoid damaging the vehicle and or the equipment all vehicle communications must be terminated before resetting the connection The Internet connection may be aborted during resetting If the communication between the VCMI device and the MaxiSys Tablet still fails restart the MaxiSys Tablet and reconnect the VCMI device 1 3 7 Glossary Waveform Type Description Sample Waveform DC Vo...

Page 135: ...iption Sample Waveform Square Wave A non sinusoidal periodic waveform with the duty cycle of 50 Square Wave X Y A special square waveform with normal and missing teeth signals Triangle Wave A asymmetrical triangular waveform ...

Page 136: ...us check performance Different preconditions for different functions Before check please read the inspection guides carefully The pin number for OBDII varies by vehicle modes Please check and confirm for correct pin number and then proceed inspection Select OBDII connector s signal pins manually if the test vehicle s actual communication signal pins are assigned differently Ensure the DLC main cab...

Page 137: ...nnector 3 Input Channel A 4 Input Channel B 5 Input Channel C 6 Input Channel D 1 4 3 Getting Started Before opening the OBDII CAN Bus Check application you have to complete three steps below 1 Connect the VCMI device to the Tablet via Wi Fi or the supplied USB 2 Connect the VCMI device to the vehicle s OBDII connector 3 Place the ignition in the key on position ...

Page 138: ...o open the OBDII CAN Bus Check Menu 4 Select a communication protocol to test 1 4 4 Update The operating software of the device is continually optimized Tap the Help button in the upper half of the screen 1 4 4 1 APK Update NOTE The acronym APK Android Package Kit is used on the tablet and in this manual This file contains all the assets of a particular app To update the APK is to install the late...

Page 139: ...ation message displays Figure 1 3 Sample Update Confirmation Screen 3 Tap OK to update the software or tap Cancel to exit 1 4 5 Screen Layout and Operations The OBDII CAN Bus Check application allows you to select the communication protocols the signal pins and voltage value for testing ...

Page 140: ...Tap the OBD app icon Figure 1 4 Sample OBD Communication Line Inspection Menu Screen 1 Upper Toolbar Buttons see Upper Toolbar Button on page 140 for details 2 Main View Section see Main View Section and Lower Toolbar Buttons on page 145 for details 3 Lower Toolbar Buttons see Main View Section and Lower Toolbar Buttons on page 145 for details 1 4 5 1 Upper Toolbar Buttons The upper toolbar button...

Page 141: ...enu on page 144 for more information OBD Button This OBD button indicates the OBD device connection status A green check mark means the VCMI and the tablet are connected a red X means no connection has been established Start Stop Button You can tap the Start Stop Button icon to start or stop the device Name Button Description Start Tap to start the device Stop Tap to stop the device Settings Menu ...

Page 142: ...select the pin assigned for high speed CAN bus communication line CAN L select the pin assigned for low speed CAN bus communication line Reset restore the default settings Save save the changes when custom pin assignment is set Close exit the settings menu screen To select the signal pins manually 1 Tap the gear shaped icon in the top navigation bar to enter the Settings Menu 2 Tap CAN H or CAN L ...

Page 143: ...tch the test vehicle s actual communication signal pins Figure 1 7 Sample Settings Menu Screen 3 4 Tap Save to save changes or tap Close to exit without saving File Menu The File button allows you to print open and save the waveform data The File Menu is enabled in the Waveform Mode and supports the following functions ...

Page 144: ...the corresponding information and then tap Save or Save Default to finish NOTE A file name is required to save the waveform Open Waveform Tap to retrieve the saved waveforms To select and or delete the saved waveform tap the Edit button in the upper right corner of the screen Save as text Tap to save the current waveform data to a text file Use the ES File Explorer app on the Android home screen t...

Page 145: ...plication and the installed versions of the software and firmware 1 4 5 2 Main View Section and Lower Toolbar Buttons Two modes are available in the OBD communication line inspection function Indicator Mode and Waveform Mode Indicator Mode This mode is designed to show the condition of voltage fluctuation in vehicle s communication lines In this mode the indicator light of a selected pin flashes w...

Page 146: ... signal pins are assigned differently you can select OBDII connector s signal pins manually in the Settings Menu When the electronic control units send out signals properly the left and right indicator lights will flash consecutively on the screen NOTE The flashing indicator lights serve to confirm only that communication signals have been detected Lower Buttons Protocol Button In the left lower c...

Page 147: ...n low speed CAN networks each device has its own termination Single CAN offers baud rates up to 33 3 Kbit s up to 88 3 Kbit s for high speed mode J1939 CAN is used in the commercial vehicle area for communication throughout the vehicle with the physical layer defined in ISO 11898 Under J1939 11 and J1939 15 the data rate is specified as 250 Kbit s with J1939 14 specifying 500 Kbit s J1850 PWM SAE ...

Page 148: ...with tablet successfully Please refer to the Connection Diagram 2 Place the ignition in the key ON position 3 Select the High Speed CAN protocol in the lower corner of the screen 4 The OBDII connector pin numbers that the signals are using are indicated and the indicator lights flash consecutively NOTE If the indicator lights are not flashing ensure the ignition is in the key on position and that ...

Page 149: ... and voltage level respectively The voltage level can be configured in the Amplitude Settings and the time duration can be set in the Time Base Settings Channel Selection Each channel has two conditions selected and unselected Some operations depend on the selected condition of the channel such as voltage rulers waveform movements and waveform zooming To select and unselect the channel 1 Tap the z...

Page 150: ...the cycle time duration and frequency The vertical Time Ruler Tap the Ruler Activator in the bottom left corner of the grid and drag it across the screen to the desired position A Time Ruler is generated The horizontal Voltage Ruler The Voltage Ruler can be generated in the similar way by clicking the Ruler Activator in the top right corner and dragging it downwards When Measurement Rulers are gen...

Page 151: ...cannot be moved once unselected Tap the baseline marker again to select Figure 1 15 Sample Zero Baseline Screen Lower Toolbar Buttons The measurement buffer and time base can be configured at the lower toolbar Table 1 2 Lower Toolbar Buttons Name Button Description Protocol Tap to select an appropriate protocol See Protocol Setting on page 152 for more information Communication Line Tap to select ...

Page 152: ...propriate time per division See Time Base on page 159 for more information Indicator Tap to switch to the Indicator mode Protocol Setting Seven types of communication protocols are available High Speed CAN Low Speed CAN Single CAN J1939 CAN J1850 PWM J1850 VPW and J1708 SAE To select a protocol 1 Tap the Protocol button in the lower left corner of the screen A dialog box opens Figure 1 16 Sample P...

Page 153: ... Line The communication line selection varies according to the protocol selected Tap the appropriate communication line at the bottom of the screen Figure 1 18 Sample Communication Line Button Screen Amplitude Setting After selecting the protocol type you can also set the amplitude value for that type ...

Page 154: ... button at the bottom of the screen A dialog box displays Figure 1 19 Sample Amplitude Button Screen 2 Select the appropriate amplitude for the protocol Figure 1 20 Sample Amplitude Setting Screen 3 Tap the X icon to close the dialog box Trigger ...

Page 155: ...ger point displays as a blue point Figure 1 21 Sample Trigger Button Screen The edge trigger is one of the most common trigger modes and is activated when voltage rises above or falls below a preset threshold This trigger type allows you to configure the trigger mode threshold trigger channel and pulse direction settings Tap Done to save the settings or tap Cancel to exit without saving When the d...

Page 156: ...ure 1 22 Sample Trigger Settings Screen Trigger Mode Three trigger modes are available None Auto and Repeat Figure 1 23 Sample Trigger Mode Screen The table below offers brief description of each trigger mode ...

Page 157: ...s If there is no trigger event nothing will be displayed on the screen Channel Select the applicable trigger channel from the dropdown menu The selected channel is the communication line that the device monitors for the trigger condition Pulse Direction Two pulse direction settings are available Rise and Fall Figure 1 24 Sample Pulse Direction Screen Rising Edge Trigger Indicates trigger is turned...

Page 158: ...er mode trigger channel and pulse direction in the dropdown list 3 Input the value in the Threshold field in the trigger settings dialog box 4 Tap Done to save settings or tap Cancel to exit without saving Buffer The waveform buffer shows which signal waveform is displayed on the current screen and how many signal waveforms are captured and stored in the buffer memory Figure 1 25 Sample Buffer Scr...

Page 159: ...y waveforms are in the buffer Next Tap to display the next waveform in the buffer Time Base The time base controls the time interval across the device display Tap the Time Base button at the bottom to open the setting dialog box Figure 1 26 Sample Time Base Screen 1 Figure 1 27 Sample Time Base Screen 2 ...

Page 160: ...tton Figure 1 28 Sample Indicator Button Screen 1 4 6 Troubleshooting If the VCMI device cannot communicate with the MaxiSys Tablet Ensure the VCMI device is properly connected to the MaxiSys Tablet via Wi Fi or with the supplied USB cable Ensure the pin number is set properly Ensure the ignition is in the Key ON position Restart tablet and reconnect the VCMI if communication continues to fail 1 4...

Page 161: ...icle With respect to Open System Interconnection model OSI J1708 defines the physical layer Common higher layer protocols that operate on top of J1708 are SAE J1587 and SAE J1922 The protocol is maintained by SAE International SAE J1939 Society of Automotive Engineers standard SAE J1939 is the vehicle bus recommended practice used for communication and diagnostics among vehicle components It is us...

Page 162: ...OTE This equipment has been tested and found to comply with the limits for a Class B digital device pursuant to Part 15 of the FCC Rules These limits are designed to provide reasonable protection against harmful interference in a residential installation This equipment generates uses and can radiate radio frequency energy and if not installed and used in accordance with the instructions may cause ...

Reviews: