background image

EVAL-AD7177-2SDZ User Guide 

UG-849


Rev. 0 | Page 13 of 14 

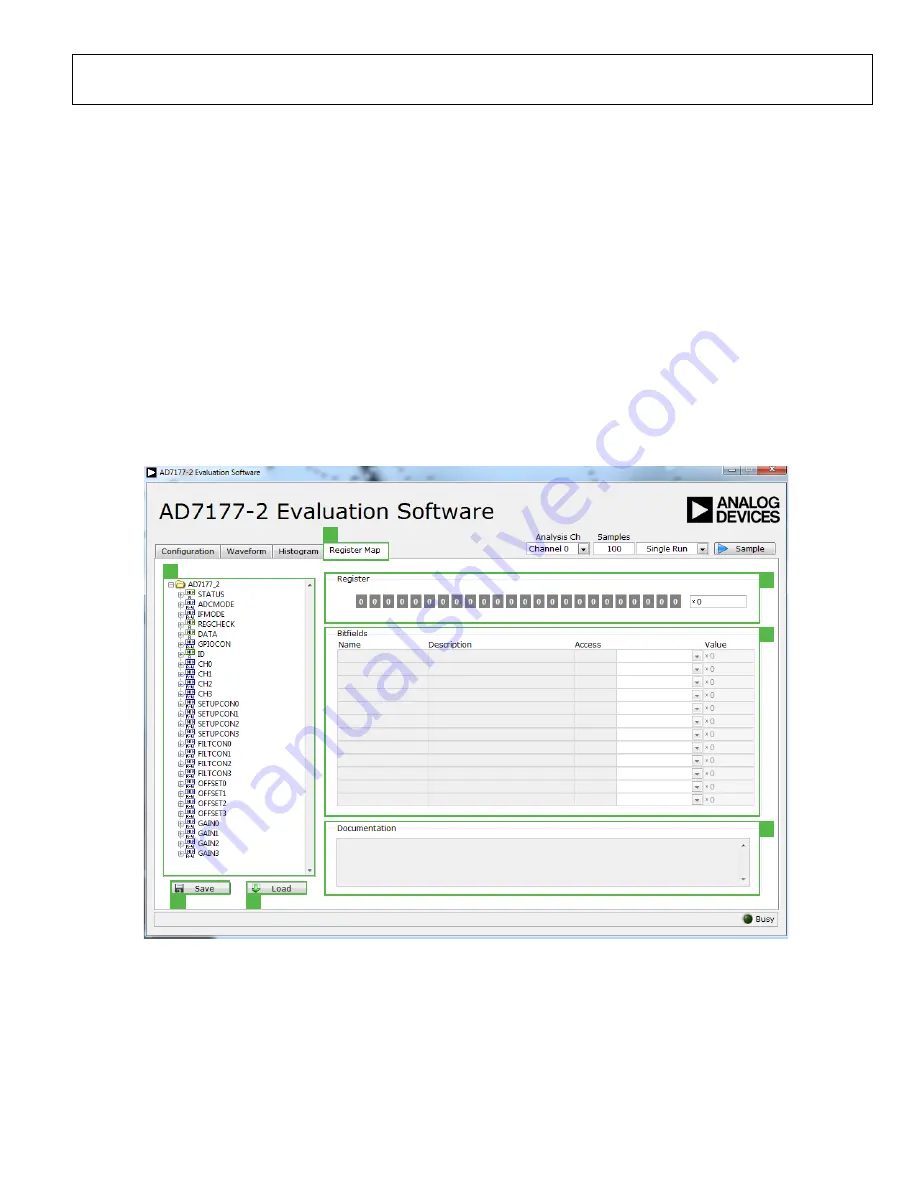
REGISTER MAP TAB (22) 

Register Tree (23) 

The register tree control shows the full register map in a tree 
control. Each register is shown. Click the 

Expand

 button next to 

each register to show all the bit fields contained within that 
register (see Figure 10).  

Register (24) 

The 

Register

 control allows you to change the individual bit of 

the register selected in the register tree (labeled 23 in Figure 10). 
Click the bit in the register tree (labeled 23 in Figure 10) or 
program the register value directly into the number control on 
the right (see Figure 10). 

Bit Fields List (25) 

The 

Bitfields

 list shows all the bit fields of the register selected 

in the register tree (labeled 23 in Figure 10). Change the values 
using the drop-down menu or by directly entering a value into 
the number control on the right (see Figure 10). 

Documentation (26) 

The 

Documentation

 field contains the documentation for the 

register of bit field selected in the register tree (labeled 23 in 
Figure 10. 

Save and Load (27 and 28) 

The 

Save

 and 

Load

 buttons allow you to save the current 

register map setting to a file and load the setting from the same 
file (see Figure 10). 

EXITING THE SOFTWARE 

To exit the software, click the 

Close

 button at the top right 

corner of the 

AD7177-2 Evaluation Software

 window (see 

Figure 7). 

22

23

24

25

26

27

28

1

328

2-

01

0


Figure 10. 

Register Map

 Tab of the 

AD7177-2

 Evaluation Software 


Summary of Contents for EVAL-AD7177-2SDZ

Page 1: ...e EVAL AD7177 2SDZ evaluation board connects to the USB port of a PC via the EVAL SDP CB1Z SDP controller board The AD7177 2 evaluation software fully configures the AD7177 2 device functionality via a user accessible register interface and provides dc time domain analysis in the form of waveform graphs histograms and associated noise analysis for ADC performance evaluation Full specifications for...

Page 2: ...t 3 Evaluation Board Hardware 4 Device Description 4 Hardware Link Options 4 Sockets and Connectors 5 Serial Interface 6 Power Supplies 6 Power Supply Configurations 7 Analog Inputs 7 Reference Options 7 Evaluation Board Software 8 Software Installation 8 Launching the Software 8 Software Operation 9 Overview of the Main Window 9 Configuration Tab 1 9 Waveform Tab 8 10 Histogram Tab 19 12 Register...

Page 3: ...on B 5 Connect the SDP B board to the PC via the USB cable For Windows XP search for the SDP B drivers Choose to automatically search for the drivers for the SDP B board if prompted by the operating system 6 Launch the AD7177 2 evaluation software from the Analog Devices subfolder in the Programs menu QUICK START NOISE TEST Use the following procedure to quickly test the noise performance 1 Insert...

Page 4: ...ese links sets up the on board noise test close to the ADC analog inputs In this mode all inputs short to REFOUT SL1 A Sets the voltage applied to the AVDD2 pin Operates using the AVDD1 supply default Position B sets the AVDD2 voltage to 3 3 V supply from the ADP7118 3 3 V U10 regulator SL2 A Selects between an external or on board AVDD1 source Supplies AVDD1 from the ADP7118 5V U7 default SL3 A S...

Page 5: ...r connectors 2 mm SMT power jack Kycon KLDX SMT2 0202 A MOUSER 806 KLDX SMT20202A J6 Analog input terminal block wired connection to external source or sensor Power socket block 8 pin 3 81 mm pitch Phoenix Contact MC 1 5 8 G 3 81 FEC3704774 J9 External bench top voltage supply option for AVDD1 AVDD2 IOVDD and AVSS inputs on the AD7177 2 Screw terminal block 3 81 mm pitch Phoenix Contact MKDS 1 4 3...

Page 6: ...ating in split supply mode Each supply is decoupled where it enters the board and again at each device in accordance with the schematic Table 3 shows the various power supply configurations available including split supply operation Table 3 Power Supply Configurations1 Configuration InputVoltage Range Description Single Supply Regulated 7 V to 9 V The 7 V to 9 V input is regulated to 5 V for AVDD1...

Page 7: ...itor circuitry to work with the lower AVDD1 supply of 2 5 V Set all other links and solder links to the default settings as outlined in Table 1 Split Supply Unregulated To set up the evaluation board use the following procedure 1 Move SL2 SL3 to Position B and SL5 to Position A 2 Remove R49 to R51 3 Connect 0 V GND to J9 at the terminal labeled AGND 4 Connect 2 5 V to J9 at the terminal labeled AV...

Page 8: ...Z Drivers Installation Confirmation Dialog Box After installation is complete connect the evaluation board to the SDP B board as shown in Figure 2 Connect the EVAL SDP CB1Z via the USB cable to the computer Follow these steps to verify that the SDP B controller board driver is installed and working correctly 1 Allow the Found New Hardware Wizard to run 2 When the drivers are installed check that t...

Page 9: ...nected by removing R32 You can change the external reference voltage value within this box to ensure the correct calculation of results on the Waveform and Histogram tabs Functional Block Diagram 4 The functional block diagram of the ADC shows each of the separate functional blocks within the ADC Click one of the configuration buttons in this graph to open the configuration pop up window for that ...

Page 10: ...nnel selection control allows you to choose which channels display on the data waveform It also shows the analog inputs for that channel labeled next to the on and off controls see Figure 8 These controls only affect the display of the channels and do not have any effect on the channel settings in the ADC register map Display Units and Axis Controls 16 Click the Display Units to select whether the...

Page 11: ...EVAL AD7177 2SDZ User Guide UG 849 Rev 0 Page 11 of 14 8 9 10 11 12 13 14 15 16 17 18 13282 008 Figure 8 Waveform Tab of the AD7177 2 Evaluation Software ...

Page 12: ...histogram graph shows the number of times each sample of the ADC output occurs The control toolbar in the histogram graph allows you to zoom in on the data see Figure 9 Click the x axis and y axis to change the scales on the graph see Figure 9 19 20 21 13282 009 Figure 9 Histogram Tab of the AD7177 2 Evaluation Software ...

Page 13: ...ds List 25 The Bitfields list shows all the bit fields of the register selected in the register tree labeled 23 in Figure 10 Change the values using the drop down menu or by directly entering a value into the number control on the right see Figure 10 Documentation 26 The Documentation field contains the documentation for the register of bit field selected in the register tree labeled 23 in Figure ...

Page 14: ...ny other party for any reason Upon discontinuation of use of the Evaluation Board or termination of this Agreement Customer agrees to promptly return the Evaluation Board to ADI ADDITIONAL RESTRICTIONS Customer may not disassemble decompile or reverse engineer chips on the Evaluation Board Customer shall inform ADI of any occurred damages or any modifications or alterations it makes to the Evaluat...

Reviews: