Analysis and reporting
User manual
Page 44 of 68
© Amberg Technologies, 2018
4.2.4.2 Graphical reports
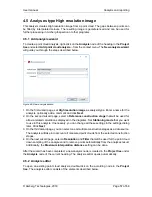
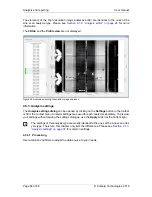
A graphical report of the analysed point cloud can be generated using the
Graphical report
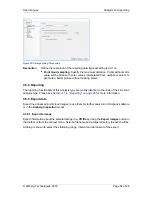
button in the toolbar or from the context menu. A dialog is shown to select the stationing range,
derolement and scale of the report
Stationing range
Input the start and end stationing off the report that should be printed.
Derolement range
Define the range along the theoretical model (profile) of the reference
construction stage which should be used. Derolement is zero on the
intersection point from the measured point cloud to the tunnel model.
Scale
Modify the scale of the analysed point cloud picture in the printed re-
port.
4.2.5 Export data
Export the enhanced point cloud data and the derived computations to use them for further
analysis in third-party software or in the
Amberg Tunnel Profile
modul. Amberg Tunnelscan
supports several export methods which are described subsequent.
4.2.5.1 Export to file
Export information about the selected point cloud to a
txt file
by using the
Export to file
button
in the toolbar or from the context menu. Select a filename and a target directory to save the
file. The txt file can easily be opened in a spreadsheet software (for example Microsoft Excel)
or in any text editor. The generated file exists of a header row and following one row for each
selected profile. It contains the following data per profile:
■
Start Heading stationing/3D Tunnelmeter
■
End Heading stationing/3D Tunnelmeter
■
Heading stationing range
■
Reference volume
■
Additional volume, Removal volume
4.2.5.2 Export point cloud to PTS or LAS
Export the analysed point cloud to a
PTS
or
LAS file
with color or reflectivity values by using
the
Export to point cloud
button in the toolbar or from the context menu. Select a range of
the point cloud that should be exported. Additionally a down sampling of the point cloud can
be done during the export. Select a target directory and the file format to save the files. They
contain the following data per section:
■
Easting, Northing, Height
■
Reflectivity value or color information
4.2.5.3 Export profiles
Export profiles to Amberg Profile moduls by using the
Export profiles
button in the toolbar or
from the context menu.
Summary of Contents for Tunnel 2.0 - Tunnelscan
Page 2: ......
Page 6: ...Page 6 of 68 ...
Page 10: ...Page 10 of 68 ...
Page 12: ...Page 12 of 68 ...
Page 26: ...Page 26 of 68 ...
Page 62: ...Page 62 of 68 ...
Page 66: ...Page 66 of 68 ...
Page 67: ......


