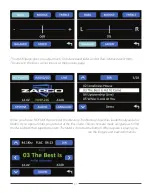
Using the Crossover Page
First note the Blue link buttons for each pair of speakers. All speakers used in pairs should be linked to
assure that left and right crossovers are identical. As you set crossover values, the crossovers trace will
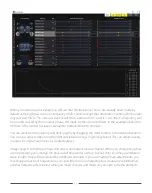
show in two places. It will show in one of the three
Crossover Curves
sections Ch1~Ch6, Ch7~Ch 12,
or Ch13~Ch16. The crossover curves area will show all active crossovers in each section, while the large
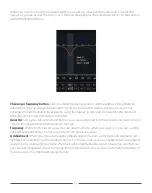
EQ graph will show the crossover of the channel you are currently working on.
At the right of the EQ graph is the
Curves Setup
column where you can add curves to the graph if you
need to see how the curves interact.
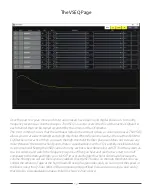
The SUM trace: The yellow trace in the graph is the sum line. This trace shows how your crossover
choices affect the response of the signal output. Every system will need to be equalized to get the
proper frequency response, but inproper crossover choices will make the equalization job much more
difficult. The Sum trace will add both left and right signal and run above the actual crossover traces. If
you show only one channel of each pair, you can keep the sum at the same level as the crossover trace
as below.
We have chosen to look at the traces
of one tweeter, one midrange, one
mid-bass, and one subwoofer. Yellow
sum trace is flat so the crossovers are
correct. At the left below, you see
crossover filters too far apart causing
a hole in the response. On the right,
the filters are overlapping, causing
a peak in the response.
In both of these cases below, the
crossover choices are making the
tuning of the system more difficult.
The yellow sum trace should always
be flat when you are finished setting
the crossovers
29
Содержание HDSP-V Series
Страница 50: ...Apex Aprilia ITALY Since 1974 zapco com...

