www.yictechnologies.com
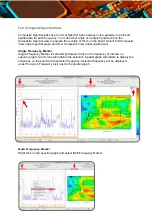
Full Composite Spectral View
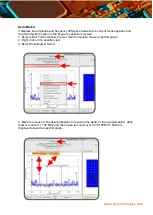
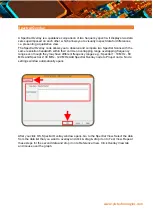
Composite Spectral looks like a normal Spectral Scan however it is a gateway to archived
spatial data for each frequency. You can select single or multiple frequencies on the
Composite Spectral view to analyze the location of them on the board. Select Full Composite
View under spectral graph and User Composite View under spatial view.
Single Frequency Marker
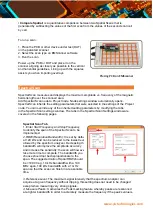
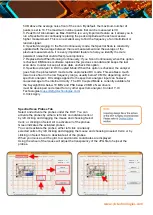
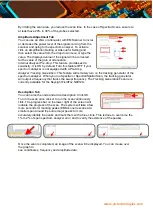
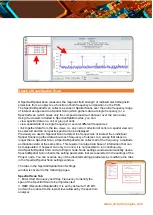
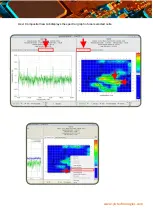
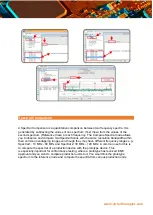
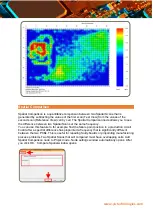
Single Frequency Marker is selected by default. Click on the frequency of interest on
spectral graph. A red cross will indicate the selection. Spatial graph will update to display the
emissions on the board at the selected frequency. Selected frequency will be displayed
under Freq List (Frequency List) next to the spatial graph.
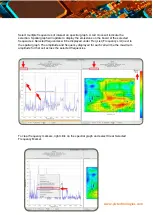
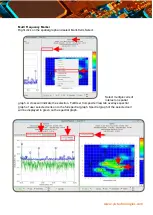
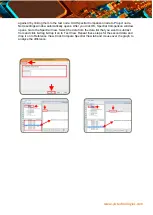
Multi Frequency Marker
Right click on the spectral graph and select Multi Frequency Marker.

