Analysis
72
1
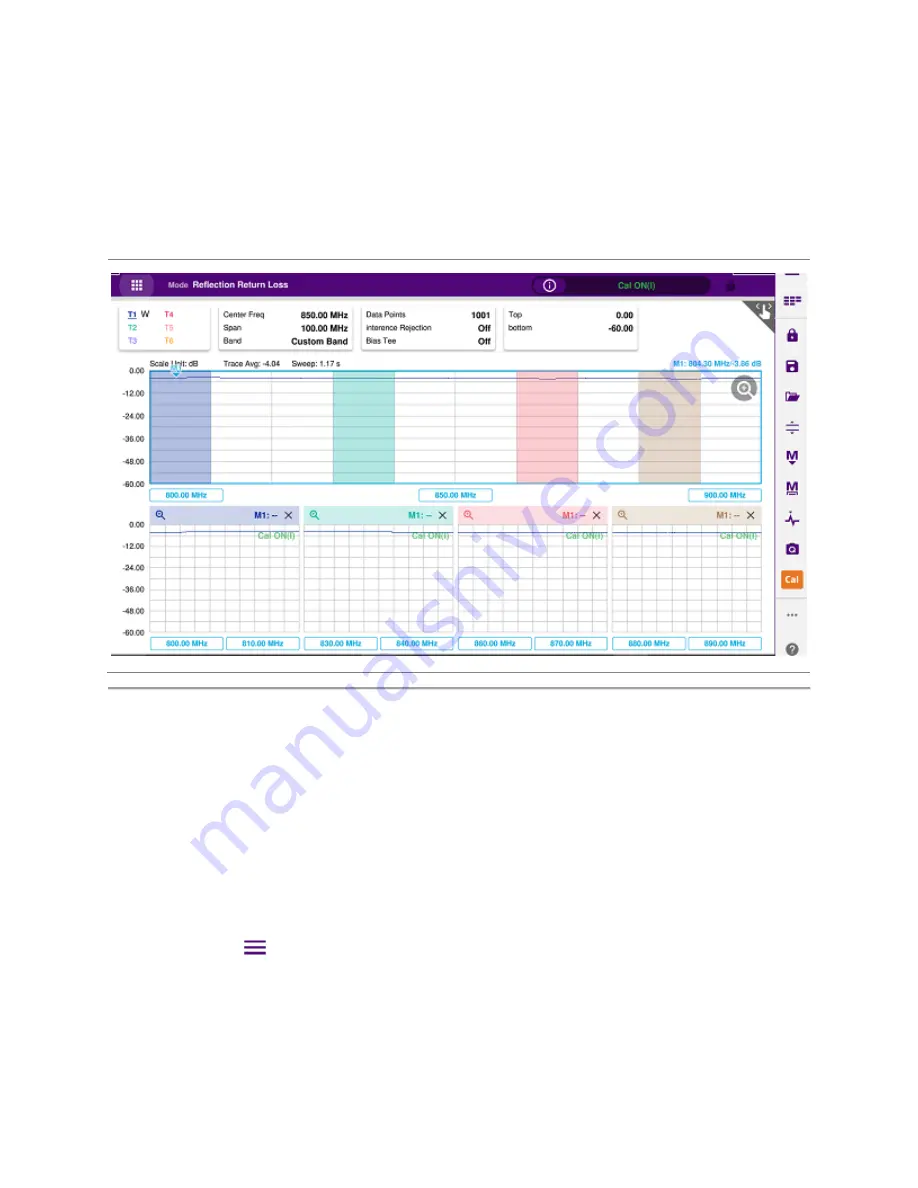
The top half of the screen shows the chart with the trace for the full O-S-L calibration band while the
bottom half of the screen displays zoom zones that you have enabled in the Zoom setting.
2
Individual zoom zones on the screen are independent from one other. Function keys correspond only
with the selected zone, which is called as the "active" chart with outside borders surrounded.
Example of zoom zones screen
Using alternate DTF band
You can use the
Alt DTF Band
that is available only in DTF measurements after a calibration to scale
down of a specific sub-band without a need of an additional calibration.
Two independent sweeps can be performed, for example, one Reflection measurement and the other
DTF measurement.
Setting alternate DTF band
1
Tap the
Menu (
)
key on the side bar and tap
Alt DFT Band
. If you have dual displays on the
screen, make sure to select a DTF measurement display for which you like to set. The alternate DTF
band setting window appears.
2
Select
On
for the
Alt DTF Band
to enable or
Off
to disable. Input the values of
Start Frequency,
Stop Frequency, Center Frequency, Span Frequency
using the on-screen keyboard.
Содержание CAA06M
Страница 2: ...1 CAA06M Cable and Antenna Analyzer User s Guide ...
Страница 3: ......
Страница 9: ......
Страница 17: ...Introduction to CAA06M 8 ...
Страница 21: ......
Страница 27: ......
Страница 42: ...CAA06M User s Guide 33 ...
Страница 43: ......
Страница 52: ...CAA06M User s Guide 43 DTF VSWR Smith chart measurement screen vertical layout ...
Страница 53: ......
Страница 59: ...1 Port Cable Loss Testing 50 ...
Страница 65: ......
Страница 71: ...Smith Chart Testing 62 ...
Страница 77: ...2 Port Transmission Testing 68 ...
Страница 95: ...Appendix 86 ...


