Personal aXsGUARD - 7.7.1
Chapter 6. Status, Logging and Diagnostics
© VASCO Data Security 2013
28
2. Navigate to VPN & RAS
⇒
Logs
⇒
Personal aXsGUARD.
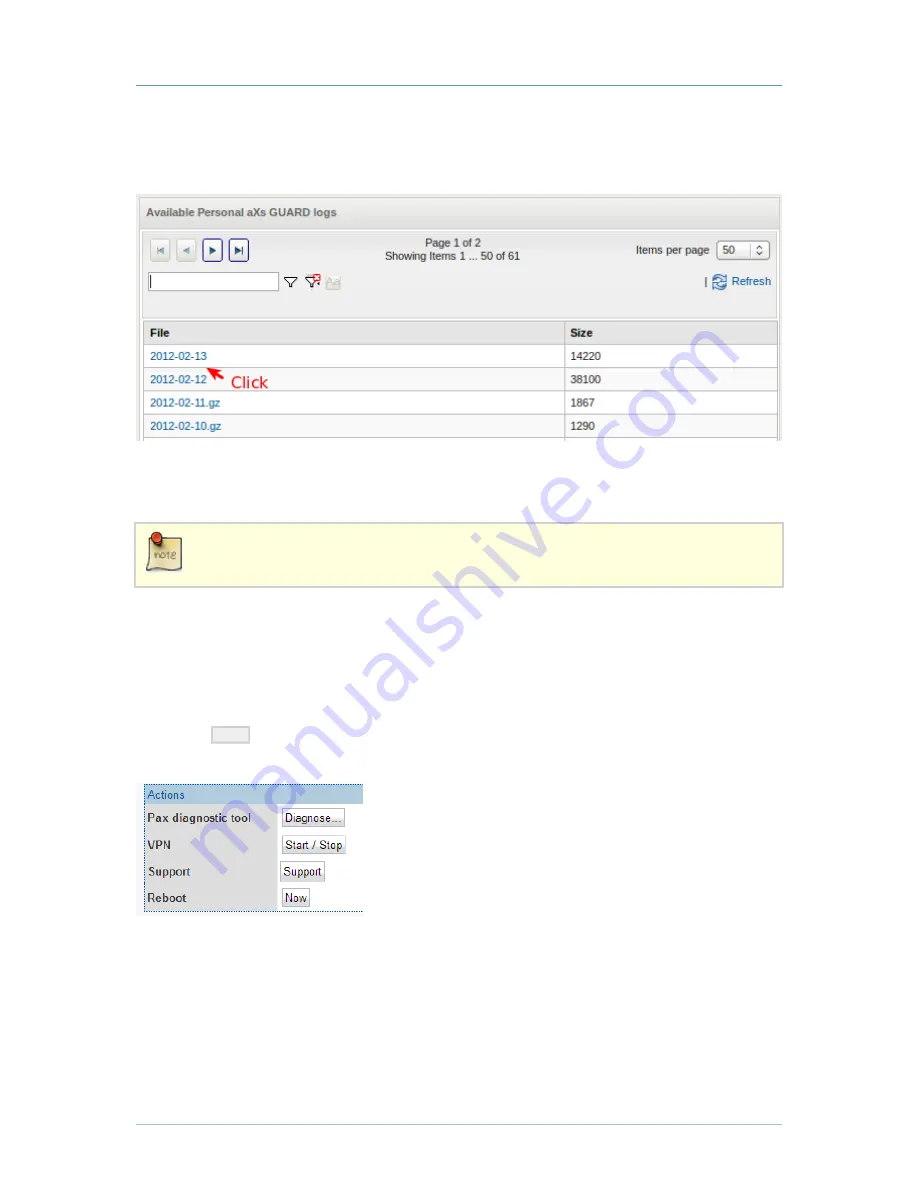
3. Select the appropriate logs (Server or Clients).
4. Click on the appropriate log date to view the corresponding log file.
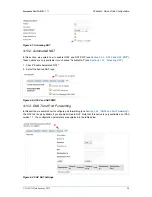
Figure 6.2. PAX Access Logs
6.3.2. On the Personal aXsGUARD
The PAX uses circular logging (16 KB of memory is available). The threshold is about 160 lines. Any
event that is logged after reaching the threshold will replace the oldest entry.
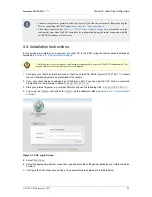
1. Log on to the PAX Administrator Tool, as explained in
Section 5.4, “Installation Instructions”
.
2. Click on Logging to view the logs.
6.4. Using the Diagnostic Tool
1. Log on to the PAX Administrator Tool, as explained in
Section 5.4, “Installation Instructions”
.
2. Click on
Home
.
3. Click on Diagnose.
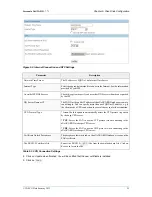
Figure 6.3. Running PAX Diagnostics
Once the process is completed, the PAX generates a report similar to the one shown in the image below. In
this example, the report indicates that the default gateway is not properly configured.

