background image

10

EN

CO₂ air quality data logger BZ30

Adjusting the scale setting

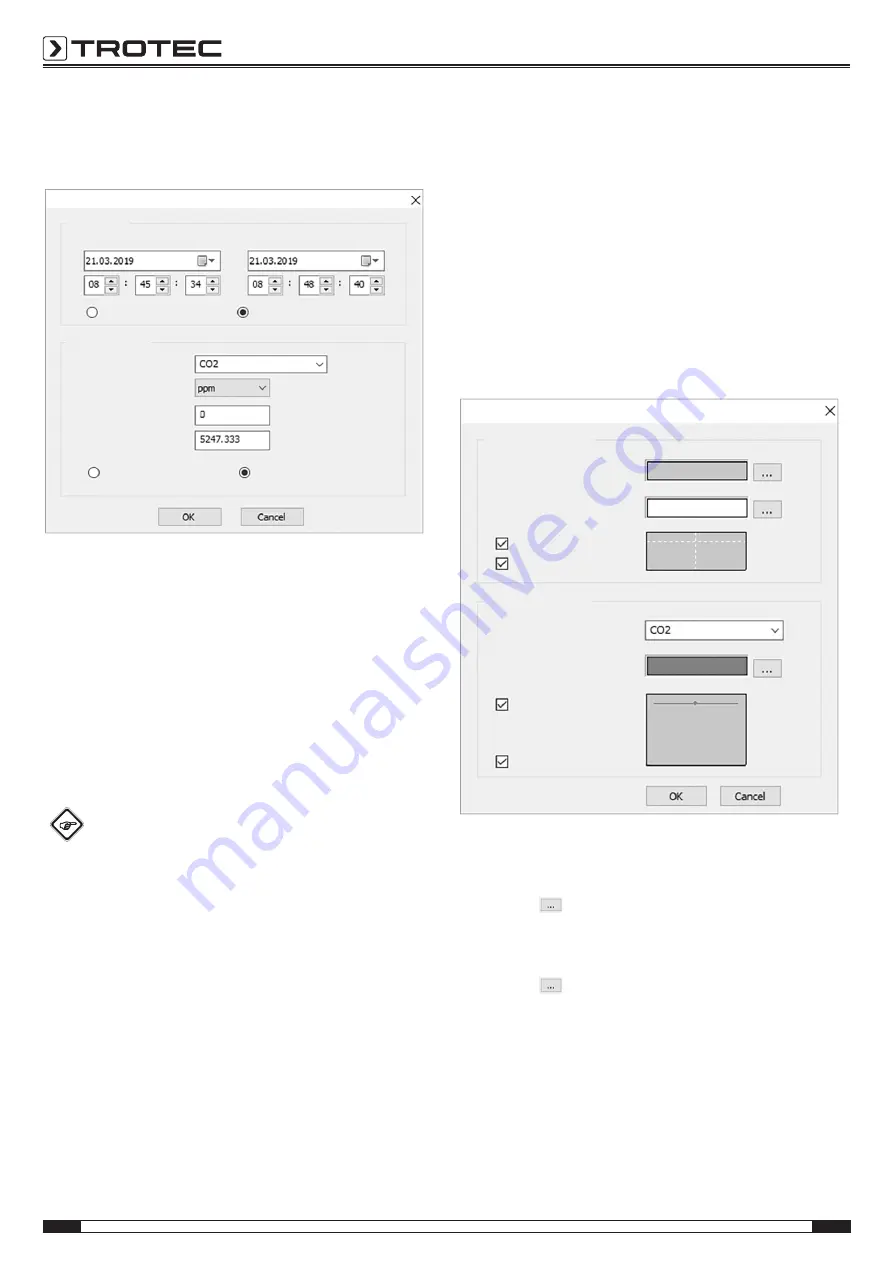
Click the 

Set scale format

 button to adjust the horizontal and

vertical graph scales. The 

Scale format

 dialog window opens.

Timescale

Start date and time

End date and time

Automatic scale

User-defined scale

Selecting a channel

Vertical scale

Unit

Minimum

Maximum

Automatic scale

User-defined scale

1. Setting the horizontal scale

Scaling of the horizontal axis is executed in the 

Timescale

section. To determine the endpoints of the horizontal axis,
select the indicated endpoints from the drop-down menus
for date and time selection.
Automatic scale:
The starting point of the horizontal scale corresponds to the
start time of the logger data file; the endpoint
correspondingly being the end time of the logger data file.
User-defined scale:
Starting point and endpoint of the horizontal scale can be
adjusted through the respective user settings.

Info

When user-defined scaling is selected and the input
starting point is earlier than the start time of the logger
data file, the starting point of the graph time scale is
used as the start time for the logger data file. 
When user-defined scaling is selected and the input
starting point is later than the end time of the logger
data file, the endpoint of the graph time scale is used
as the end time for the logger data file.

2. Setting the vertical scale

Scaling of the vertical axis is executed in the 

Vertical scale

section. First, select the measurement channel and then the
measuring unit. Set minimum and maximum value.
Automatic scale:
If you select this option, the vertical scale automatically
adjusts depending on the logged data.
User-defined scale:
If you select this option, the vertical scale is adjusted as per
the user settings.

Setting the graph format

Click the 

Set graph format

 button to adjust the graphing options

for the graph. The 

Graph format

 dialog window opens.

Graph format

Basic graph format

Selecting the background colour

Selecting the grid colour

Display horizontal axis

Display vertical axis

Data graph format

Selecting a channel

Select channel colour

Show data curve

Marks

The basic settings for all three channels are made in the 

Basic

graph format

 section.

1. Selecting the background colour:

Click the 

 button to adjust the background colour. You

can choose a basic colour or create a new colour pressing
the 

Define colours

 button.

2. Adjusting the grid colour

Click the 

 button to adjust the grid colour. You can

choose a basic colour or create a new colour pressing the

Define colours

 button.

3. Showing/hiding the grid lines

Check or uncheck the checkboxes to show or hide the
horizontal and vertical grid lines.

Содержание 3.510.205.015

Страница 1: ...TRT BA BZ30 TC2019 23 001 EN BZ30 EN OPERATING MANUAL CO AIR QUALITY DATA LOGGER...

Страница 2: ...g the device Always store the manual in the immediate vicinity of the device or its site of use Warning Read all safety warnings and all instructions Failure to follow the warnings and instructions ma...

Страница 3: ...electrical voltage Before any work on the device remove the mains plug from the mains socket and the battery from the device Hold onto the mains plug while pulling the power cable out of the mains so...

Страница 4: ...al from 1 second to 12 hours USB interface for measuring data transfer PC analysis software Device depiction 1 3 4 6 7 2 8 12 11 9 14 10 15 13 16 17 5 DC 6 V 1A No Designation 1 Main display 2 USB int...

Страница 5: ...te If you store or transport the device improperly the device may be damaged Note the information regarding transport and storage of the device Transport The supplied Li ion batteries are subjects to...

Страница 6: ...mode and to save the entered value press the ESC button once you have set the correct date and time Info You can modify the order of day month and year within the supplied software For more detailed i...

Страница 7: ...t a new recording you first have to save or delete measured values already saved on the device For more detailed information please refer to the Using the software section Using the software There is...

Страница 8: ...smData format can be opened Opens the dialog window for printing files Opens the dialog window for adjusting the settings Starts data import from the selected device Opens the help Main menu In the fo...

Страница 9: ...rs 5minutes 36seconds OK Cancel Starting recording Automatically Manual CO2 alarm settings Limit value alarm Alarm Value 1 Time settings The current system time is displayed in the Current time field...

Страница 10: ...ime of the logger data file the endpoint of the graph time scale is used as the end time for the logger data file 2 Setting the vertical scale Scaling of the vertical axis is executed in the Vertical...

Страница 11: ...dow Use the left and bottom scrollbars to shift the pane 2 Zooming out Click the Undo zoom button to show the total view Displaying individual data points There are two options to display individual d...

Страница 12: ...not be disposed of with the household waste at the end of its life You will find collection points for free return of waste electrical and electronic equipment in your vicinity The addresses can be ob...

Страница 13: ...Trotec GmbH Grebbener Str 7 D 52525 Heinsberg 49 2452 962 400 49 2452 962 200 info trotec com www trotec com...

Отзывы: