Traqmate User Manual V1.0
June 14, 2005
Copyright © 2005 Track Systems Technologies, LLC
Page 30
Segment Analysis
One of the most powerful features of Traqview is Segment Analysis. This allows you to compare
two small sections of the track on several laps. This is especially useful for comparing two drivers
who might take different approaches to a corner or for doing a before/after comparison of a new
technique or driving line.
Traqview has a default Segment “All” that is the entire lap. To look at a particular section of the
track, you must create one or more segments. This is done by dragging the Segment Icon onto
the track near where you want the Segment. Then drag the Segment Start and Segment End
Icons into position. They can be repositioned at any time to change the Segment. To delete a
segment, drag either the Start or End Segment Icon off the track.
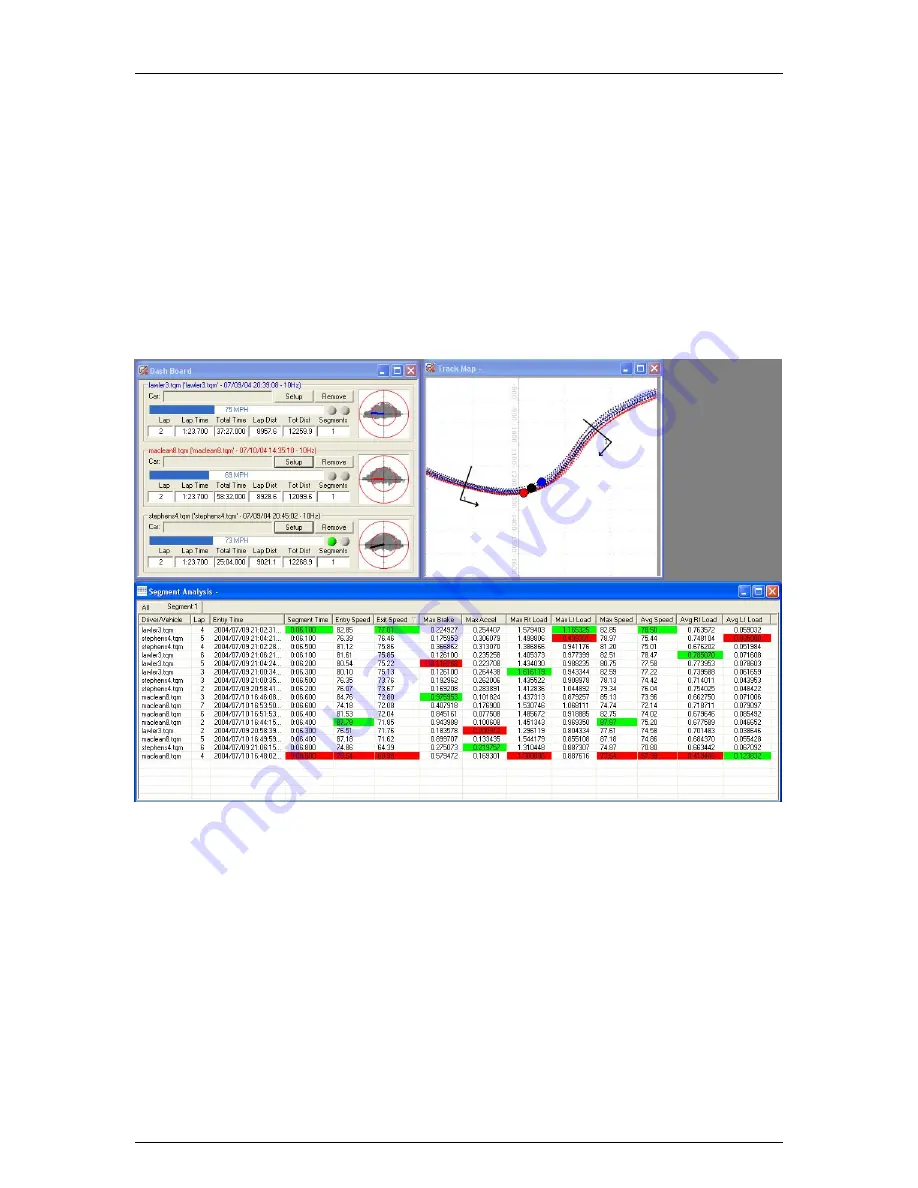
Add drivers to the Segment Analysis Table using the ‘Setup’ button on the dashboard. Note that
every lap selected for each driver is included in the table.
Figure 27 - Segment Analysis Table
Each time you create a segment, another table is added to the Segment Analysis Table Screen.
You access each table by clicking on the tabs at the top of the Segment Analysis window. Each
table shows the time required for the vehicle to traverse the segment, entry and exit speeds, the
maximum and average amount of braking and acceleration used during the segment, and the
maximum and average speeds obtained during the segment.
By clicking on a column in the table, the entire table will be sorted by the values in that column.
For example, to see the maximum exit speed, click on the Exit Speed column heading. Click on it
again and it will be sorted in the reverse order. In each column, the minimum performance value
is highlighted in red while the maximum performance value is highlighted in green.


