THS6022 EVM Performance
1-7
General Information
1.6
THS6022 EVM Performance
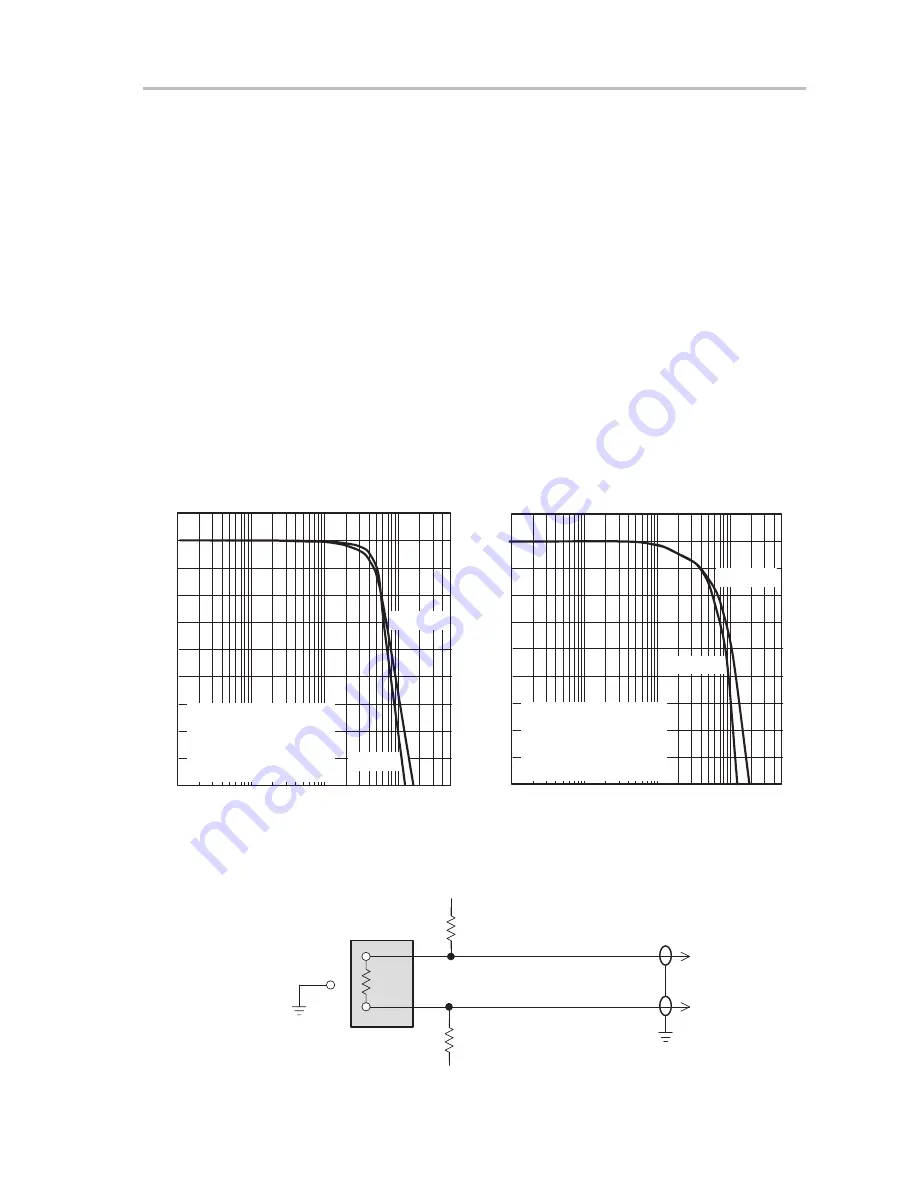
Figure 1–4 shows the typical frequency response of the THS6022 EVM drivers
when properly loaded. This data was collected using a single-ended input with
a 100-
Ω
load connected between the driver outputs, as shown in the test circuit
of Figure 1–5.
Typical – 3-dB bandwidth with a
±
15 V power supply is 70 MHz for driver 2 and
60 MHz for driver 1. With a
±
5 V power supply, typical – 3-dB bandwidth is
75 MHz for driver 2 and 70 MHz for driver 1. The difference between the output
signals of driver 1 and driver 2 is primarily due to the high-frequency
characteristics of the inverting amplifier (U1). Component values can be
changed to cause the two responses to track more closely, but since ADSL
signals are limited to 2 MHz and below, the high-frequency imbalance can
usually be ignored.
Figure 1–4. THS6022 EVM Driver Frequency Response With a 50-
Ω
Load
f – Frequency – Hz
OUTPUT LEVEL
vs
FREQUENCY
–1
–3
10M
100k
1
3
500M
Output Level – dB
5
7
1M
100M
VCC =
±
5V
VI(PP) = 2 V
RL = 200
Ω
Differential
JP1 : 1–2
JP2 : 1–2
Driver 1
Driver 2
0
–2
2
4
6
f – Frequency – Hz
OUTPUT LEVEL
vs
FREQUENCY
–1
–3
10M
100k
1
3
500M
Output Level – dB
5
7
1M
100M
VCC =
±
15V
VI(PP) = 2 V
RL = 200
Ω
Differential
JP1 : 1–2
JP2 : 1–2
Driver 1
0
–2
2
4
6
Driver 2
Figure 1–5. THS6022 EVM Driver Frequency Response Test Circuit
RL
100
Ω
Driver 2 Output
2 OUT
Pad 2
1 OUT
Pad 1
GND
Driver 1 Output
J5
J7
User Pad Area
R8
49.9
Ω
R15
49.9
Ω
Содержание ths6022
Страница 4: ...iv ...
Страница 18: ...1 12 General Information ...


