background image

CHAPTER 6. GRAPHING EQUATIONS/FUNCTIONS

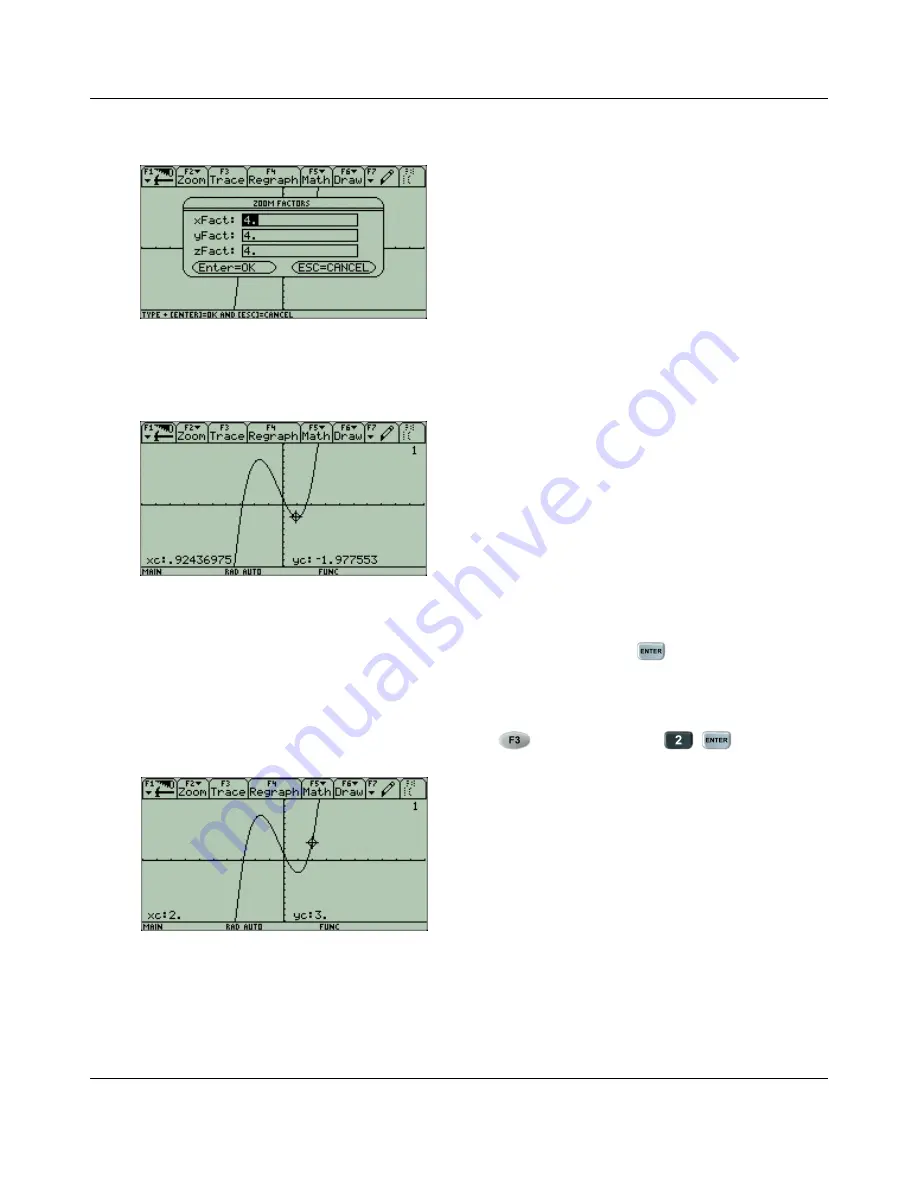
C: SetFactors...

SetFactors...

allows you to set the zooming factor for

ZoomIn

and

ZoomOut

.

It includes

xFact

and

yFact

settings for 2-dimension and

zFact

for 3-dimensional graphs.

6.6.2

F3: Trace

Trace

allows you to use the cursor to trace your graph using the left/right arrow keys. It displays

the coordinates of the cursor’s location.

If you want an integer

x

-coordinate, you can press that value and then

and the cursor will

jump to that coordinate. (You cannot specify a

y

-value.)

Example:

Trace to the point that has an

x

-coordinate of 2. Press

to trace and then

to jump to

that point.

30

Содержание TI Voyage 200

Страница 1: ...Introductory Handbook for the TI Voyage 200 c 2009 Portland Community College...

Страница 2: ...4 The Home Screen 7 2 5 Pretty Print 7 2 6 The Catalog 7 3 The Settings 8 3 1 The MODE Button 8 3 2 Changing a Setting 9 4 Performing Calculations 10 4 1 Clearing the Home Screen 10 4 2 Addition Subtr...

Страница 3: ...21 5 6 F6 Clean Up 21 5 6 1 1 Clear a z 21 6 Graphing Equations Functions 22 6 1 Entering in Functions 22 6 2 Checking Window Settings 24 6 3 Graphing the Equation 24 6 4 Clearing Previous Functions F...

Страница 4: ...priate sections of the handbook 1 2 Blue 2nd and Green Diamond At the bottom left of your calculator you have the following The two buttons and are some of the most important buttons on your calculato...

Страница 5: ...e space to the left of the cursor The button located to the right of the screen will clear an the entire line function or other entry that you have highlighted 1 5 Other Important Buttons The button a...

Страница 6: ...the screen darker hold down and press To make the screen lighter hold down and press 2 3 The App Screen When you turn your calculator on you ll have a screen that looks something like this This is the...

Страница 7: ...7x2 1 2 6 The Catalog The calculator has a limited amount of space on the keypad and cannot have a button for every operation or command that it can carry out All of the preprogrammed commands are sto...

Страница 8: ...hanged Press located under to the right of the screen to access the settings There are 3 pages of settings and you can use and to view each page Within a page use the arrows to scroll up or down betwe...

Страница 9: ...ss the right arrow to see the other options available for the Display Digits Use the up down arrows to scroll up to FLOAT Once you have FLOAT highlighted press once to make the change and go back to t...

Страница 10: ...Clear Home is highlighted and then press b Press to select the 8th command This is a handy short cut You can do this anytime you want to clear everything out of the Home Screen 4 2 Addition Subtracti...

Страница 11: ...obtain an approximation if you need it 4 3 x vs Find and buttons on your calculator is between and This is the button for the letter or variable x is in the right column with the and buttons This is t...

Страница 12: ...closing parenthesis after the 32 If you do not insert the closing parenthesis the calculator will give you a error message b As with the 6 7 this calculation also gave you the simplified exact value...

Страница 13: ...he root command uses the format root radicand index After selecting root from the catalog you need to enter in the radicand followed by a comma followed by the index and then a closing parenthesis Exa...

Страница 14: ...last 30 commands and results or history pairs that you executed with the most recent on the bottom and the least recent at the top of the list The x 30 is an indication that you have x history pairs i...

Страница 15: ...almost all computer applications Each tab gives you access to a drop down menu of commands To access any of those menus use the function keys directly below the screen You can scroll up or down withi...

Страница 16: ...story pairs from the entire Home Screen history area 5 1 2 9 Format Format allows you to change number of history pairs in the home screen from the default value of 30 to your choice of 10 20 30 90 or...

Страница 17: ...and will be helpful in any mathematics course 5 2 1 1 solve solve will solve an equation and uses the format solve equation variable You must tell it for which variable it needs to solve Do not forget...

Страница 18: ...ed to enter factor x2 3x 4 Type then Example Factor x2 3x 3 You need to enter factor x2 3x 3 Type then 5 2 3 3 expand expand will expand an expression and uses the format expand expression Example Exp...

Страница 19: ...k Please see your instructor of as sistance with this menu 5 4 F4 Other Press for the Other menu and scroll up and down to see all of the options 5 4 1 1 Define Define allows you to define a function...

Страница 20: ...bove f has already been defined otherwise you would do that now To evaluate f 5 you need to enter f 5 Type Example Solve f x 7 using f x 9x 1 from above f has already been defined otherwise you would...

Страница 21: ...ariable values This means that function definitions values etc that were saved using a single letter will be cleared out Note This can be very helpful if your calculations are coming out strange Becau...

Страница 22: ...ere are three steps when graphing a function i entering in the function you want to graph ii making sure your viewing window is what you want and iii graphing the equation Each step is explained below...

Страница 23: ...e in to the command line That information is now saved for y2 If you look at both y1 and y2 you will see a check mark next to each This indicates that y1 and y2 will both be graphed It is possible to...

Страница 24: ...n to reset the window values to the standard viewing window is to use the Zoom menu If you use the sixth option 6 ZoomSTD the calculator will automatically reset all the window settings to the standar...

Страница 25: ...functions by using the up down arrows to highlight a function and then press to delete the function from memory Do this for any function you no longer need 6 5 Changing the Window Settings Go to the Y...

Страница 26: ...by pressing Scroll down to ymin and change it to 20 Graph the function using the new window settings and you will see the entire graph Notes i With the new dimensions on the vertical axis the tick ma...

Страница 27: ...6 6 1 F2 Zoom This is exactly the same Zoom menu that you have when you are in the WINDOW screen After each option is explained I will assume that you regraph the function on the standard viewing win...

Страница 28: ...nt specified in C SetFactors see C SetFactors below The default is that you will zoom in to 1 4 of the x axis 1 4 of the y axis and your scales will become 1 4 of their previous distance When you choo...

Страница 29: ...defined 3 3 3 3 on the x axis and 4 4 on the y axis This can be helpful for a quick look at the graph of a trigonometric function A ZoomFit ZoomFit will keep your xmin and xmax values the same and the...

Страница 30: ...phs 6 6 2 F3 Trace Trace allows you to use the cursor to trace your graph using the left right arrow keys It displays the coordinates of the cursor s location If you want an integer x coordinate you c...

Страница 31: ...w you to calculate a y value when you enter in an x value and it will visually move the cursor to this x y coordinate In some ways this is similar to what you can do with the Trace feature Example Fin...

Страница 32: ...most zero will be identified Example There is a zero between 1 and 2 Estimate that zero Press to use the Zero command You must tell the calculator to look between 1 and 2 For the lower bound use the a...

Страница 33: ...value between the x values of 0 and 2 Press to use the Minimum command For the lower bound use the arrow keys to move the cursor near an x value of 0 and then press Notice that there is now a triangle...

Страница 34: ...xample Find the maximum y value between the x values of 3 and 0 Press to use the Maximum command For the lower bound use the arrow keys to move the cursor near an x value of 3 and then press Notice th...

Страница 35: ...Example Find the intersection point between y1 x3 x2 5x 1 and y2 x 4 First go back to the Y menu enter in y2 x 4 and then graph both functions Press to use the Intersection command Identify the 1st C...

Страница 36: ...to use any of the three There are three steps when graphing a function i entering in the function s you want to view in a table ii making sure your table setup is what you want and iii using the tabl...

Страница 37: ...n the command line That information is now saved for y2 If you look at both y1 and y2 you will see a check mark next to each This indicates that y1 and y2 will both be included in the table It is poss...

Страница 38: ...n If you re using Auto you will need to adjust the following settings tblStart This value will be the first x value used in your table tbl This value is the distance between each x value in the table...

Страница 39: ...for the function saved as y1 The third column contains the corresponding y values for the function saved as y2 You can use your left right arrow keys to move between columns and your up down arrow key...

Отзывы: