


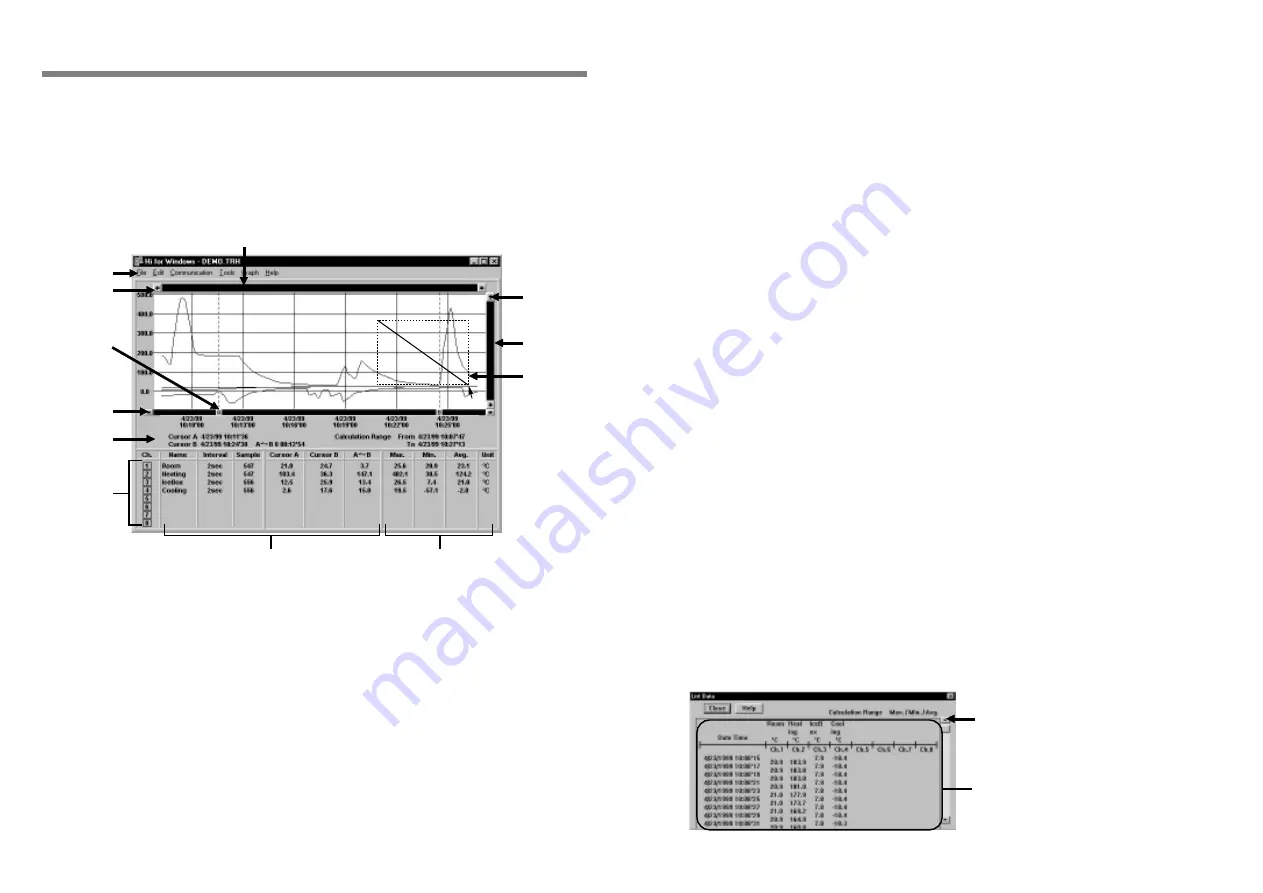
Data List Display
⑤
⑤
⑤
⑤
⑤
Cursor Movement Button
By clicking the arrow buttons you can move the cursor or cursors together left or right. Only
operable for cursors which are activated
⑥
⑥
⑥
⑥
⑥
Time and Date for Cursor at Point A and B, Time Gap between Point A and B,
Effective Calculation Range (Max. Min., Avg.)
⑦
⑦
⑦
⑦
⑦
Channel Number Button
・
By clicking a Number Button the display can be turned ON /OFF
・
By dragging a channel button to another channel and dropping it the data will be moved to
that channel.
・
By double clicking a channel button a dialog box will appear that will allow you to delete the
data or change the recording settings for that channel.
⑧
⑧
⑧
⑧
⑧
Data Name, Recording Interval, Amount of Data, Data at Cursor A, Data at
Cursor B, Difference between A and B
⑨
⑨
⑨
⑨
⑨
Maximum Value, Minimum Value, Average Value, Temperature Unit
By double clicking the number value for Max or Min the display will move to that point on the
graph.
⑩
⑩
⑩
⑩
⑩
Button for Moving Vertical Axis
The Vertical Axis moves up or down by clicking these arrow buttons.
⑪
⑪
⑪
⑪
⑪
Vertical Gauge Bar
Allows you to move across the whole range of data from the lowest value to the highest for all
eight channels. The colored bar represents the data presently displayed as a part of the total.
By dragging the gauge you can move up and down to the data you want to be displayed.
⑫
⑫
⑫
⑫
⑫
Magnification and Widening Using the Mouse.
Magnification : With the left button drag the mouse to outline the area you want to
magnify.
Widening : By double clicking the right button the data area will be widened at a regular
interval to allow you to see a larger range.
This is a list of the data that was displayed in graph form.
Maximum Value is in RED, Minimum is in
BLUE, and Average is in PINK.
Scroll Bar: By dragging it up and down
you can move to the data you want.
15
Graph Display
①
①
①
①
①
Horizontal Gauge Bar
Allows you to move across the whole range of data from oldest to newest for all eight channels.
The colored bar represents the data presently displayed as a part of the total. By dragging the
gauge you can move left and right to the data you want to be displayed.
②
②
②
②
②
Menu Bar
Click the menu bar you want to display a pull down menu from which you can choose from an
array of commands.
③
③
③
③
③
Button for Moving Horizontal Axis
The time axis moves by clicking these arrow buttons.
④
④
④
④
④
A and B Cursor Buttons
Click and drag the A or B button to move the cursor left or right. By left clicking on the button
you can activate or disactivate the cursor movement function.
⑨
⑨
⑨
⑨
⑨
⑧
⑧
⑧
⑧
⑧
②
②
②
②
②
③
③
③
③
③
Screen Names and Functions
●
This screen is only a representation for explanation purposes and may differ
from actual screen.
●
For a detailed explanation of operations use the [Help] menu.
④
④
④
④
④
⑤
⑤
⑤
⑤
⑤
⑥
⑥
⑥
⑥
⑥
⑦
⑦
⑦
⑦
⑦
①
①
①
①
①
⑫
⑫
⑫
⑫
⑫
⑪
⑪
⑪
⑪
⑪
⑩
⑩
⑩
⑩
⑩
16


