46
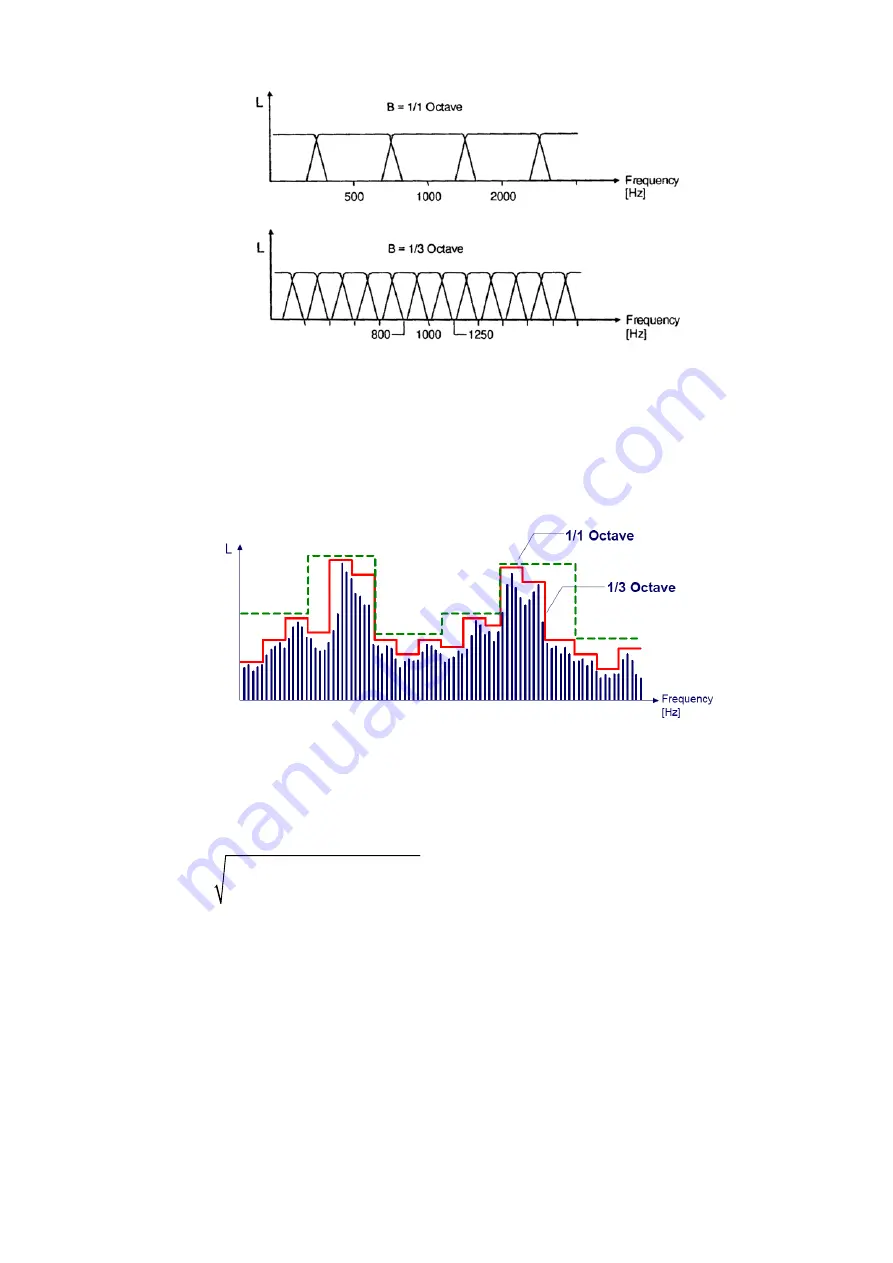
[Fig. V-3-3] 1/1 and 1/3 Octave Bandpass Filters
1/1 and 1/3 octave bandpass filters are shown in [Fig. V-3-3]. As previously mentioned, we can
calculate the octave data from FFT spectrum. The relationship is shown in [Fig. V-3-4].
[Fig. V-3-4] Relationship between FFT Spectrum and Octave Analysis
Equation for calculating is <Eq. V-3-1>.
/ 2
2
1/ 3
0
Window Correction
N
Octave
i
i
y
y
=
=
⋅
∑
<Eq.
V-3-1>
where
i
y
is the spectrum of FFT.
1/ 3
Octave
y
is the octave value of each band.
i
is frequency index
in the spectrum.
4. Weighting
Microphone is reacted uniformly as the frequency of sound. So when you measure the sound using
a microphone, you can’t get the sound level as you hear the sound because the ear of human being
hears sound differently according to the frequency.
Equal Loudness Contour represents the curve that the human being feels equal loudness of sound
Содержание SLA-PA201
Страница 64: ...64 Appendix 1 The Theory for calculating RMS by ISO2631 and ISO8041 ...
Страница 67: ...67 Appendix 2 Frequency Response of Filter in the Vibration Level Meter ...
Страница 75: ...75 Appendix 3 Theory of WBCombined Filter and Frequency Response ISO6954 Filter ...
Страница 79: ...79 Fig 2 Lowpass Filter with 100Hz Cutoff Fig 3 a v transition Frequency Response ...
Страница 88: ...88 Fig 12 Error between theoretical value and measured value ...


