Super Systems Inc.
Page 64 of 107
Color Touch Screen Data Logger Operations Manual
unsaved data will be lost
. Any unsaved data will need to be saved before printing the multiple
setpoint survey report.
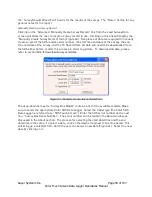
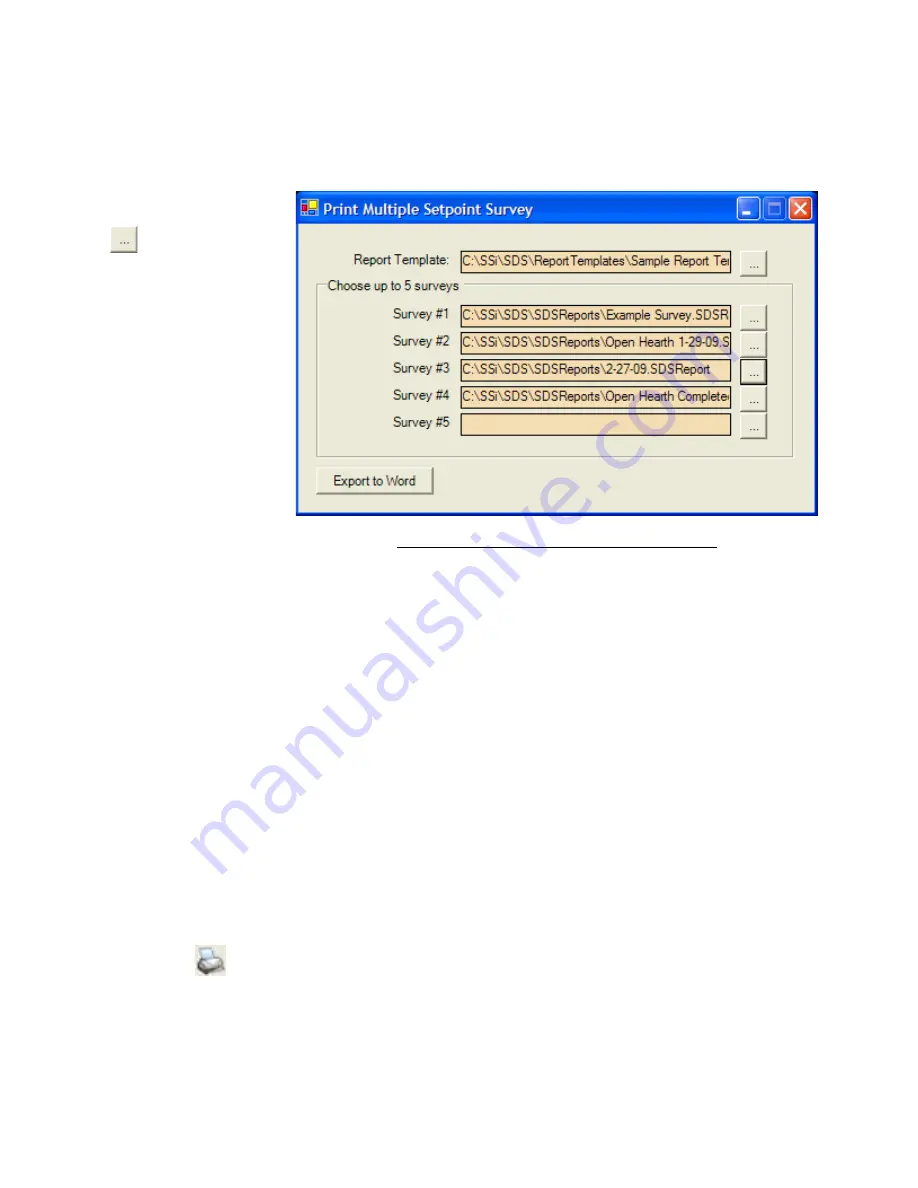
The Print Multiple Setpoint Survey screen will allow the user to select a report template that
utilizes the multiple setpoint survey tags (described below) and up to 5 survey files
(.SDSReport).
The search buttons -
- next to each field
will allow the user to
select the specific
report template or
survey file for the
report.
Once the report
template and survey
files have been
selected, the user will
be able to export the
report to Word by
clicking on the Export
to Word button.
In order to view the
multiple setpoints on a
survey, the user will
need to use the {
n
} tag, where
n
is the survey number from the
Print Multiple Setpoint Survey
screen (Figure 82). What the {
n
} tag does is tell the report to use the
n
th survey information for
all of the following tags until another {
n
} tag is found. Using the displayed screen as an
example, the following could be an excerpt from the template file:
{1} Survey #1 Duration: <SDS:DUR>
{2} Survey #2 Duration: <SDS:DUR>
{3} Survey #3 Duration: <SDS:DUR>
Setpoint: <SDS:SP>
Max TC Value: #mtcv#
{4} Survey #4 Duration: <SDS:DUR>
This survey would display the durations for each of the survey files, and it would also display the
survey setpoint and max T/C value for survey #3. Notice that the normal data tags are still
used. The new tag only tells the software which survey to pull data from.
Note – For single
survey reports, the report template file does not need to be updated
. If no {
n
} tag is used, the
software will default to the first survey file. On the actual report the {
n
} tag is invisible.
When the
Print Multiple Setpoint Survey
screen is closed down, the main SDS Reporter screen
will re-open.
Print Button
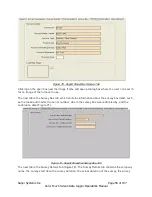
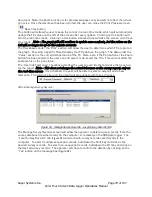
When the user clicks on the Print button, the software will display the print preview screen,
which is similar in design and function to the print preview screen on the View Real-time chart
(
Figure 90
or
Figure 83
below).
Figure 82 - Print Multiple Setpoint Survey screen

