


Spectrometer
D
=
2
⋅
R
0
(17)
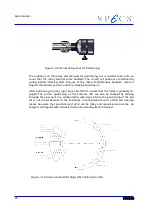
The experimentally determined dispersion value can be slightly different, mainly due to
fringing fields at the edges of the analyzer.
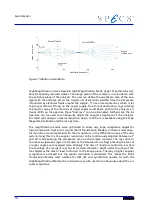
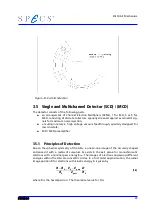
Multichannel detection is performed by appropriately arranging 5 or 9 CEM‘s as collect-
ors with 5 or 9 exit slits on concentric circles in the exit plane. The radial distance
between neighbouring exit slits
∆
R is selected to meet the requirement of a constant
kinetic energy difference between neighbouring channels
∆
E
k
. The number of particles
N
n
arriving at each collector C
n
is counted separately, and these numbers are stored and
preprocessed in the data acquisition unit.
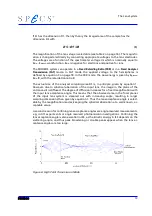
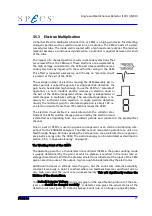
By sweeping the spectrometer voltage U
0
, the electron path is moved across each col-
lector channel step by step, and in this way each collector records a complete spectrum,
with a fixed energy offset between neighbouring channels. In principle, by sweeping
the spectrum once over the detector area, 5 or 9 parallel spectra are recorded simultan-
eously. As the kinetic energy E
n
of the particles arriving at collector C
n
is known from
equation 16, the number of particles from each channel, belonging to the same kinetic
energy can simply be added, resulting in a total number of particles for each kinetic en-
ergy.
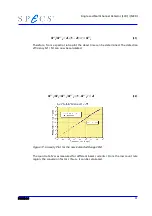
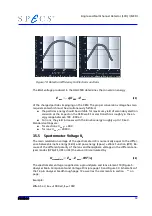
3.5.2 Coherence of E
pass
and Step
From the analyzer energy dispersion equation, the energy difference
∆
Ek between
neighbouring channels at the distance
∆
R one from another is
E
k
=
R
D
⋅
E
pass
(18)
or
E
pass
=
D
R
⋅
E
k
(19)
where D is the analyzer dispersion.
Especially in the FRR mode, where the pass energy changes throughout the spectrum
(and thus the energy difference between neighbouring channels) a calculation of the
detected energy of the particle is necessary. Therefore a software routine calculates the
particle number N
n
in channel C
n
at the nominal kinetic energy, by interpolation
between the numbers actually measured in channel C
n
at the measuring energies
nearest below and nearest above the nominal energy.
This algorithm is unequivocal, because there is never more than one nominal energy
between two measured energy positions. Due to the interpolation routine, there is no
restriction on the energy step due to analyzer performance. Power supply performance
(DAC steps, etc.) limit the possible step widths and ranges. The software validates the
values to the nearest allowed values.
26
Содержание PHOIBOS 100
Страница 1: ...PHOIBOS Hemispherical Energy Analyzer Series PHOIBOS 100 PHOIBOS 150 3 1...
Страница 6: ...Table of Contents PHOIBOS...
Страница 10: ...Introduction 4 PHOIBOS...
Страница 13: ...Electrical Connections Figure 2 Connection Scheme PHOIBOS 7...
Страница 14: ...Components and Connections Figure 3 Analyzer Housing PHOIBOS100 8 PHOIBOS...
Страница 15: ...Electrical Connections Figure 4 Analyzer Housing PHOIBOS150 PHOIBOS 9...
Страница 42: ......
Страница 51: ...SpecsLab Hardware and Software Installation PHOIBOS 45...
Страница 52: ......
Страница 62: ......
Страница 78: ...Analyzer Checks Figure 33 Schematics of the 12 pin Analyzer Feedthrough 72 PHOIBOS...
Страница 80: ......
Страница 86: ......
Страница 92: ...List of Figures Figure 39 Alignment Pin 84 II PHOIBOS...
Страница 93: ...List of Figures PHOIBOS III...
Страница 94: ......
Страница 96: ......
Страница 98: ...Index PHOIBOS...


