22
Logging
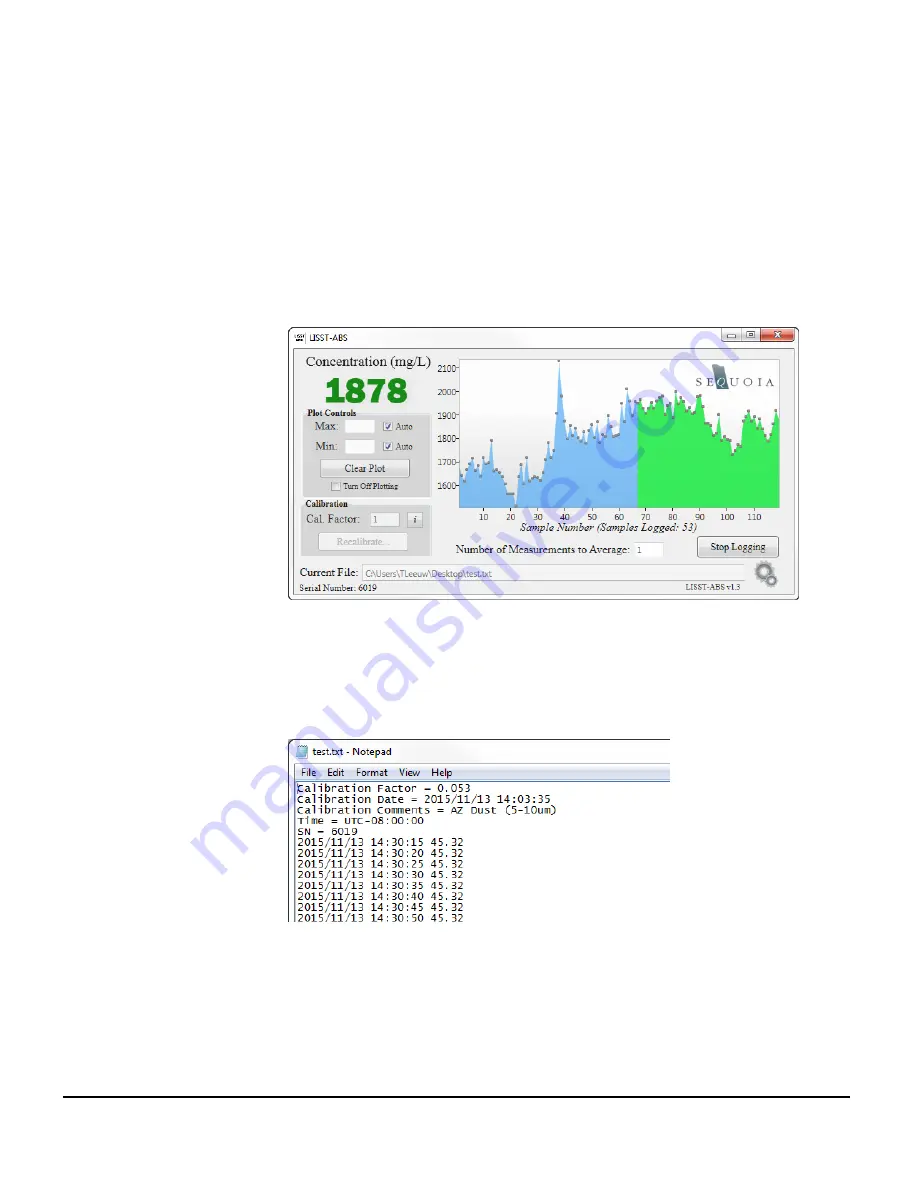
Logging is initiated by pressing the ‘Start Logging’ button. A
browser will open that allows you to specify a location and
name for the log file. Once that is complete, the location of the
log file will be displayed at the bottom of the screen (note: the
location displayed at the bottom of the screen can also be
edited by hand, which is handy for incrementing file names).
After selecting a file, data logging begins immediately. The
number of logged measurements is shown just below the
concentration plot.
The log file header contains calibration information, the
computers current time zone, and the instrument serial number.
The header is followed by three columns of data: date, time,
and concentration (mg/L).
Data Plotting
The LISST-ABS software automatically plots concentration as a
function of sample number.
Data shown in the plot is color coded to indicate what operation
the software is preforming. If the concentration is simply being
displayed with no logging or calibration being performed, data
are plotted in blue. If concentration is actively being logged to a
text file, data are plotted in green. If the instrument is currently
Содержание LISST-ABS
Страница 2: ......


