


Tel: 886. 909 602 109 Email: [email protected]
www.salukitec.com
107
Soft Key 1
Soft Key 2
Soft Key 3
Soft Key 4
Soft Key 5
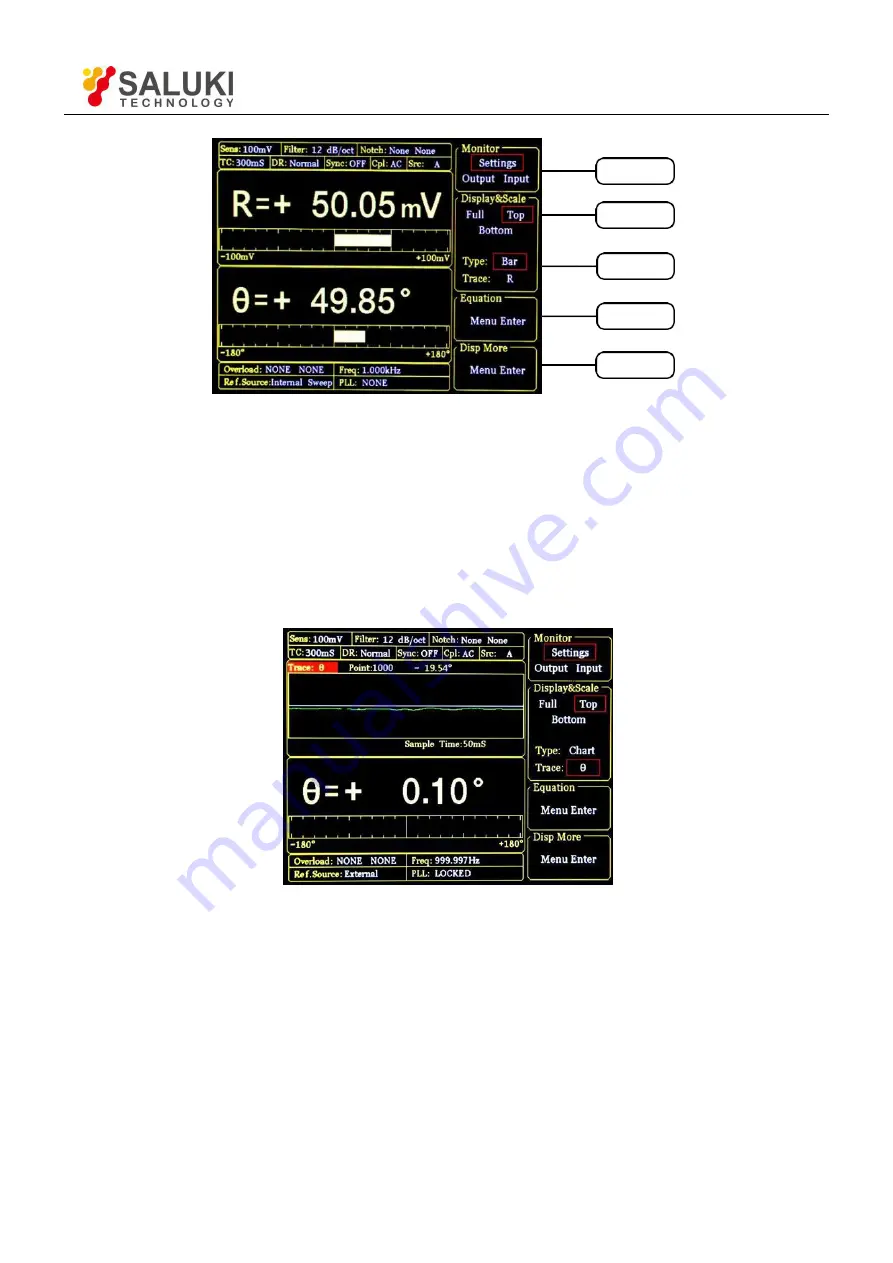
Fig.86 [DISPLAY] Menu Interface
You can change the display way according to steps below.
Change the display <R> in top area to display the <
θ
> with XY Coordinates Chart. First, press the [soft key 2] to
choose <Top>; second, press [soft key 3] to choose <Type> and the <Type> area will be highlighted. Then, spin
the knob to choose <Chart> (XY Coordinates) or <Bar> (percentage). And we choose <Chart>;
Third, press [soft key 3] to choose <Trace> and the <Trace> area will be highlighted. Spin the knob to choose the
value of <R>, <X>, <Y> and <
θ
>. We choose <
θ
>. After these settings, the result is shown in Fig.87
.
Fig.87 Display <
θ
> in XY Chart
7. The monitor bar of main interface displays the value of <R>, 7.<X>, <Y> and <
θ
>.
Users can change which value to display as the following steps:
Press [DISPLAY] in front panel to enter the submenu. Then, press [soft key 1] to set the <Monitor> from
<Setting> to <Output>. Now the monitor bar will display the value of <R>, <X>, <Y> and <
θ
>, as is shown in
Fig.88.


