Tel: 886.2.2175 2930 Email: [email protected]
45
5.5.6
DISPLAY
The waveform display is affected by settings of the oscilloscope. A waveform can be measured once it is captured.
The different styles to display a waveform on the screen give significant information about it.
There are two modes to display waveforms Single-window and Dual-window. Refer to
information.
Push the DISPLAY button and the following menu appears.
Options
Settings
Comments
Type
Vectors
Dots
Vectors fills up the space between adjacent sample points in the display; Dots only
displays the sample points.
Persist
OFF
0.2S-8S selectable
Infinite
Sets the time length to display each displayed sample point.
Format
YT
XY
YT format shows the vertical voltage in relation to time (horizontal scale); XY format
displays a dot between CH1 and CH2 each time when a sample is acquired, where
the voltage or current of CH1 determines the X coordinate of the dot (horizontal) and
the voltage or current of CH2 determines the Y coordinate (vertical). For detailed
information, refer to descriptions on XY format in the following text.
Contrast
0-15 16 ranks adjustable, with a progress bar to display; Press F5 to select this
option. Turn the multi-functional knob to adjust.
Next Page
Grid
Dotted line
Real line
OFF
Off only displays the horizontal and vertical coordinates at the center graticule on the
screen.
Grid Intensity
0-15 16 ranks adjustable, with a progress bar to display.
Refresh Rate
Auto, 30 frames,
40 frames, 50 frames,
Wave Intensity
0-15 16 ranks adjustable, with a progress bar to display.
5.6
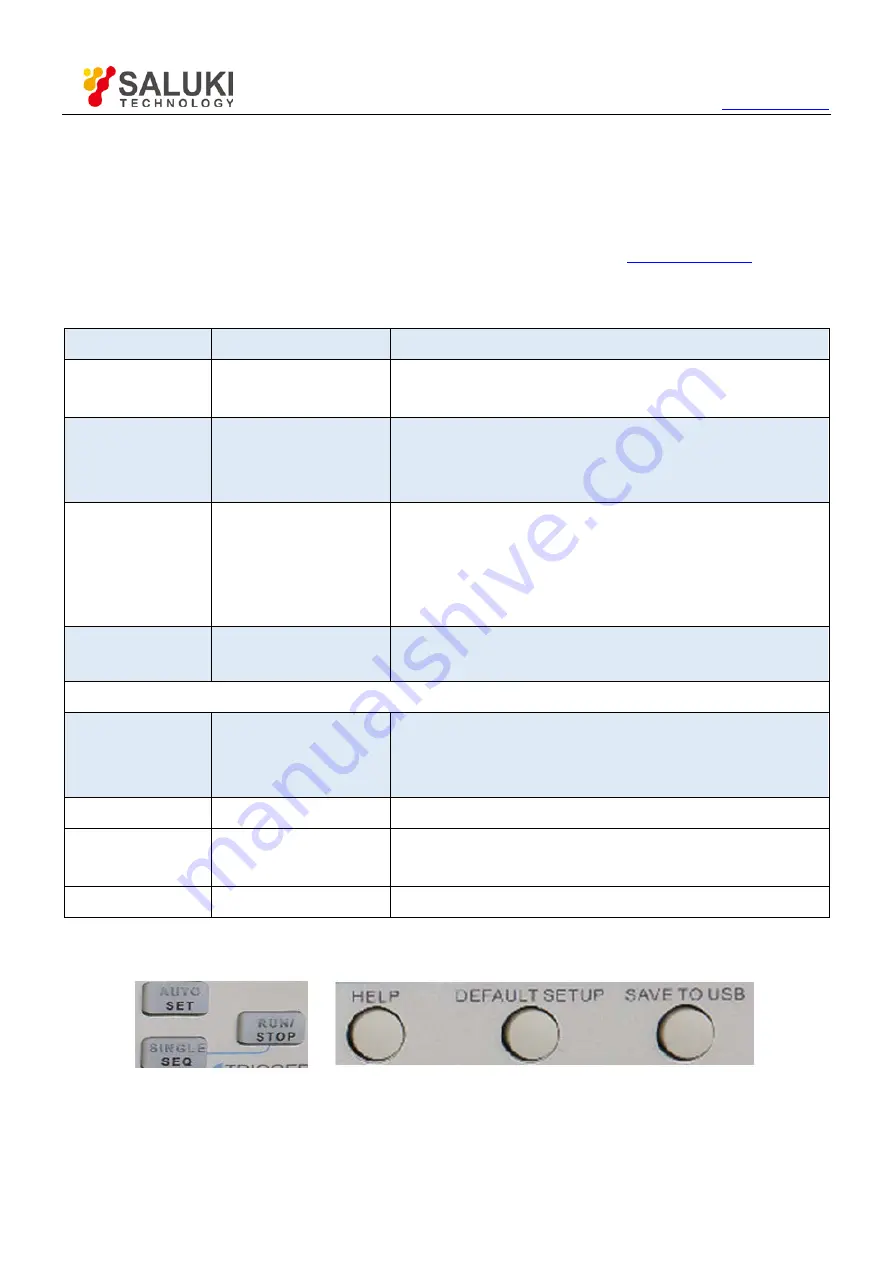
Fast Action Buttons
AUTOSET: Automatically set the oscilloscope controls to generate a usable display of the input signals. Refer to
the following table for relative content.


