80
it and move mouse to mark files by frame) or with “Ctrl” and “Shift” keys help in
the "Import” dialog.
4.
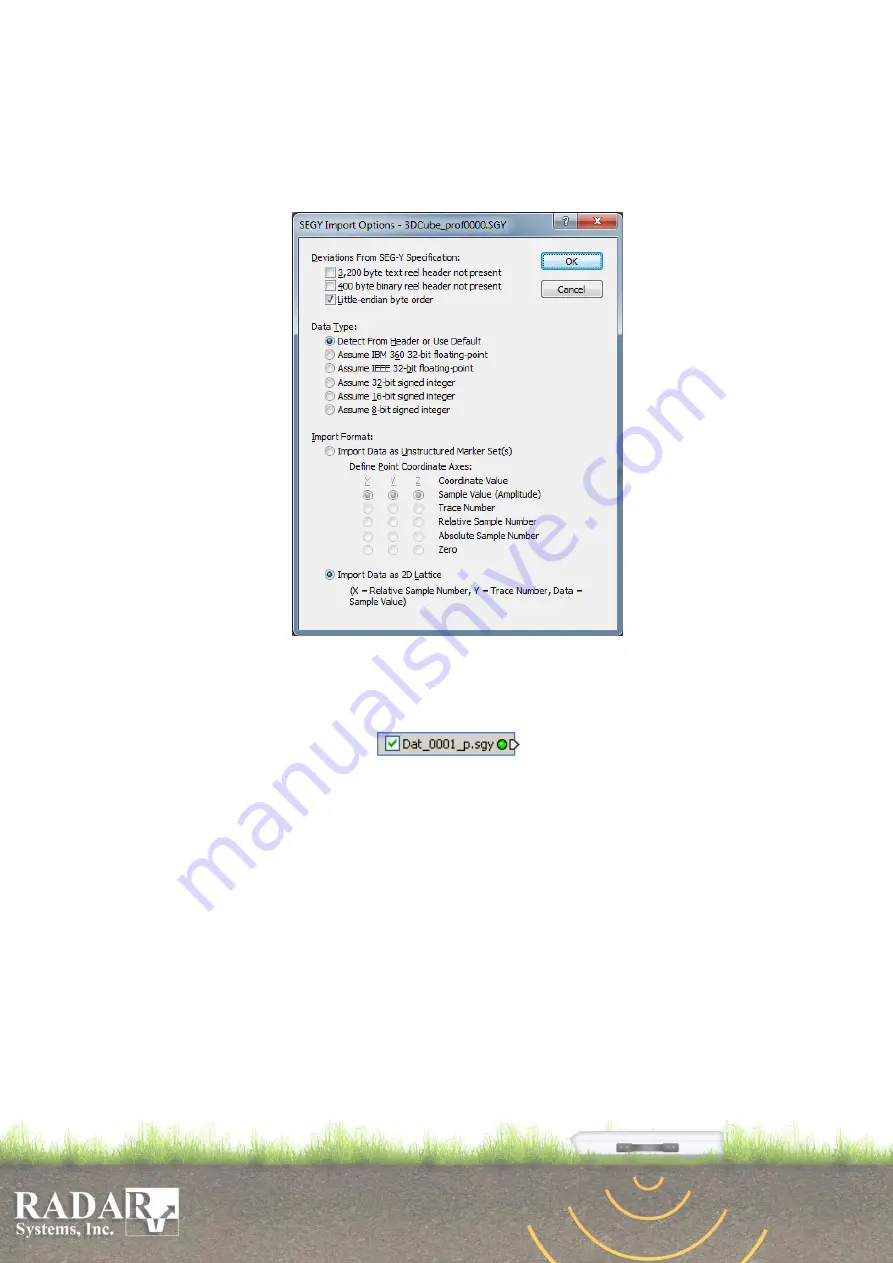
You have to set SEGY Import Options as it shown on the picture bellow (Deviation
from SEG-Y Specification: Litle-endian byte order, Data Type: Detect from
Header, Import format: Import data as 2D Lattice.)
Fig. 12.2. SEGY Import Options
5.
Voxler represents separate file or the array of files as a module (like a single small
box with the name of first file, check button for enabling/disabling and small arrow
on the right/left box side
). If you marked some files like an
array, but Voxler represents it in the different objects, and then imported profiles
don’t match in samples and/or in traces (check it in the Prism software, and if
necessary cut unmatched profiles).
6.
You have to be sure, that all “Geometry Limits” of the imported data module are
set properly (to see it just left-mouse click on the module and follow to the
“Properties” area of Voxler window - "Geometry" tab). The X axis corresponds to
the Samples/Time/Depth axis of the GPR data profile. The Y axis corresponds to
the Traces/Distance axis of the GPR data profile. And the Z axis corresponds to the
Width (profiles offset between each other) of 3D-cube for the files array. The
Voxler calculates “Coordinate Limits” from imported files and gets it like samples
quantity for X, traces quantities for Y, and 0 for Z. You could apply the calculated
values and change only Z value (for the files array) by yourself, but the correct way
is to apply all XYZ values in meters (Distance, Depth and Width). Distance and
Depth you could get from Prism software.
7.
You could visualize bounding box of your 3D-cube by adding new “Graphic
Output” (click right mouse button on the imported data module in the “Network”


