Fig. 2.1: Zabbix login screen
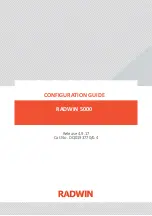
2.3.2. Dashboard
Personal Dashboard
is displayed after you login. With full-access you would be able to change the
layout as you wish.
On the following picture, you can see that NMS monitors two RAy units, two RipEX units and two GPRS
units (M!DGE and MG102). Zabbix is monitoring itself too.
Several triggers were defined to display the warning if any unit is in the undesired state (e.g. modem
temperature is too high, RSS level is out of the threshold range, etc.). In our example, there are two
events with
RAy10-H
(RSS and SNR values) and one event with
MG102
(VPN deactivation).
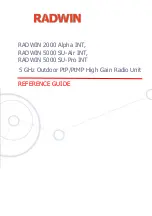
On the left side Zabbix menu, you can add favourite
graphs
,
screens
and
maps
. We provide several
examples which are described in the following sections.
The main Zabbix
navigation bar
is at the top of the screen.
15
© RACOM s.r.o. – RipEX – Radio modem & Router
ZABBIX – Live DEMO