28
C
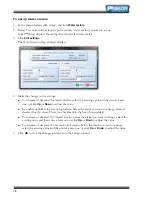
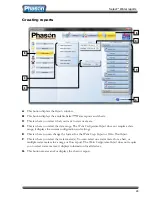
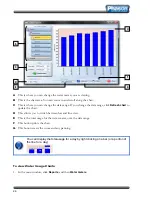
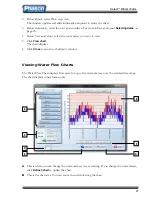
This is where you can change the date range. If you change the date range, click
Refresh chart
to
update the chart.
D
This allows you to increase or decrease the line width. The default is 2.
E
This button resets the zoom and any panning.
F
This is the legend for the chart.
G
This button prints the chart.
To view Water Flow Charts
1.
In the main window, click
Reports
, and then
Water meters
.
2.
Below
Reports
, select
Water flow chart
.
The window updates and adds information required to create the chart.
3.
Below
Report dates
, select the start and end dates. For more information, read
Selecting dates
on
page 25.
4.
Below
Your water meters
, select the water meters you want to view. You can select up to five water
meters.
5.
Click
View chart
.
The chart displays.
6.
Click
Close
to return to the
Reports
window.
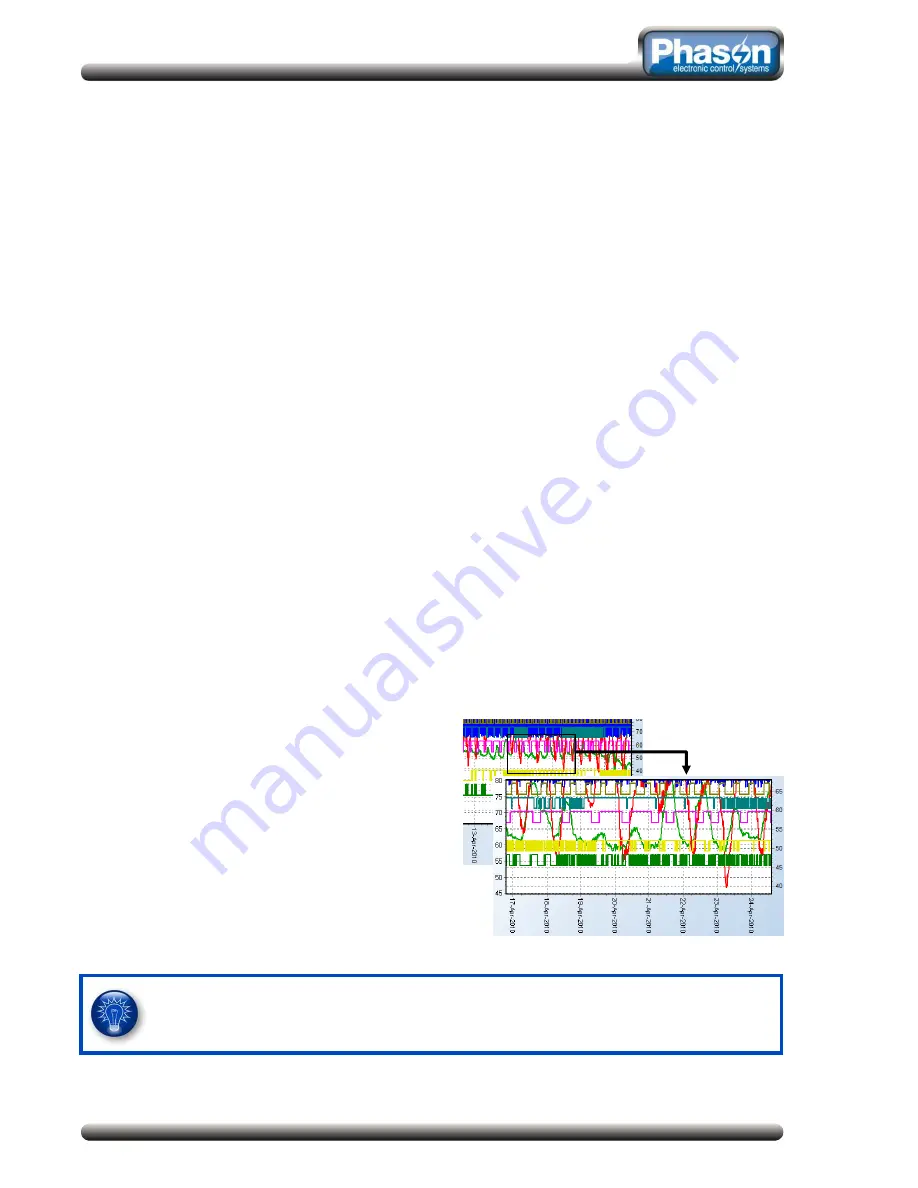
To zoom and pan charts
You can zoom in, zoom out, and scroll along a chart.
To zoom in
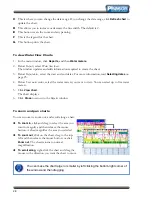
, click and drag to select the area you
want to magnify and then release the mouse
button. A chart magnifies the area you selected.
To zoom out
, click on the chart, drag to the top-
left and then release the mouse button, or click
Zoom out
. The chart returns to normal
magnification.
To scroll along
, right-click the chart and drag the
mouse in the direction you want the chart to move.
You can make the chart larger or smaller by left clicking the bottom-right corner of
the window and then dragging.

