


Appendix G Converting Analysis Data into a Chart Using EXCEL
G-4
Page
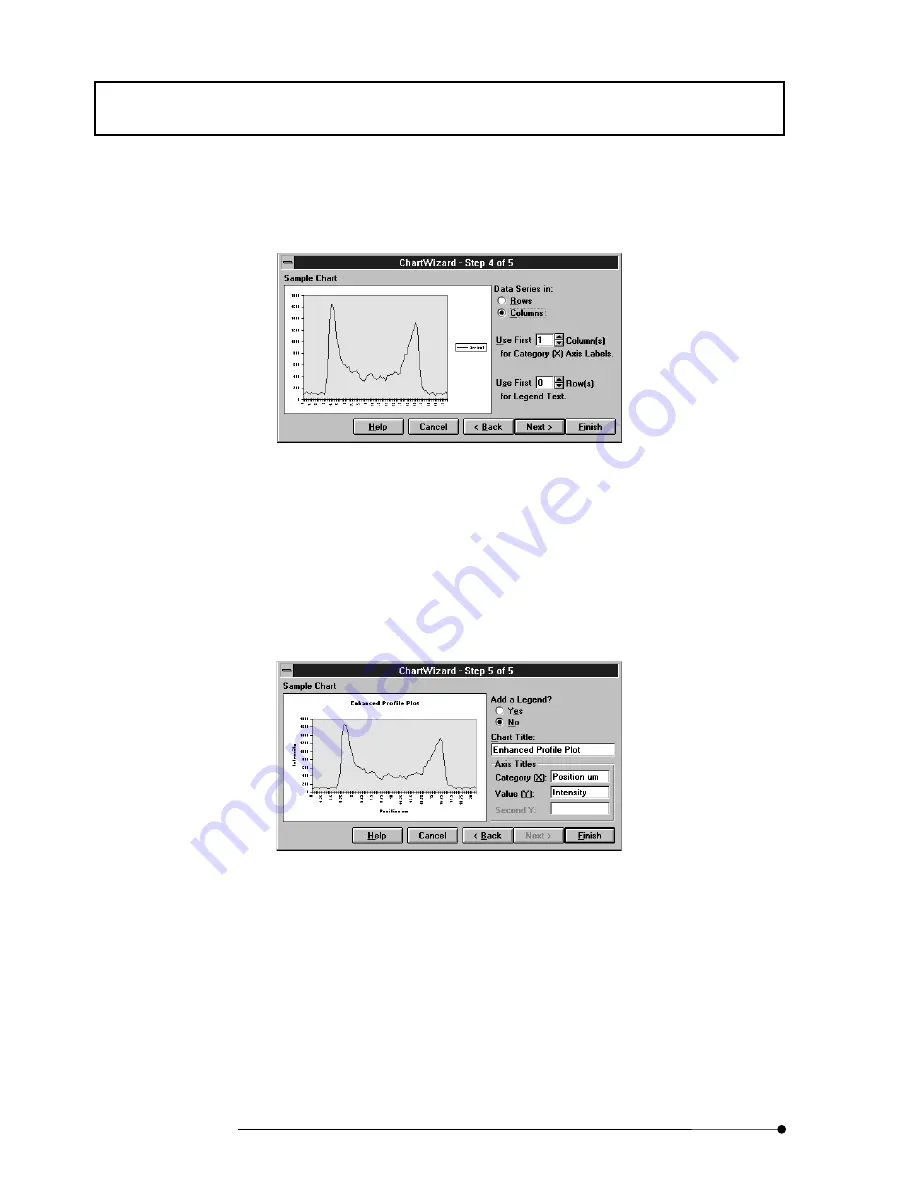
11. Select the desired chart format and click the <Next> button. The dialog box as
shown below appears.
Fig. Appendix G-7 Dialog Box of Chart Wizard (4/5)
12. Click the [Columns] option button under [Data Series in:].
13. Set the data column number that you want to use as the X-axis label position in the
[Use First Column(s)] text box.
14. Click the <Next> button. The dialog box as shown below appears.
Fig. Appendix G-8 Dialog Box of Chart Wizard (5/5)
15. Enter the chart title in the [Chart Title] text box.
16. Enter the X-axis label in the [Category (X):] text box and the Y-axis label in the
[Value (Y):] text box.
Содержание FLUOVIEW FV500
Страница 2: ......
Страница 8: ......
Страница 10: ......
Страница 24: ......
Страница 110: ......
Страница 261: ...APPLIED OPERATIONS Changing the Image Display Method 2 151 Page Fig 2 62 Panel Displaying Images Per Channel ...
Страница 318: ...APPLIED OPERATIONS Building an Image from a Different Viewpoint 2 208 Page Fig 2 100 Panel Showing Extended Focus Image ...
Страница 327: ...APPLIED OPERATIONS Viewing 3D Image 2 217 Page Fig 2 106 Panel Showing Stereo 3D Images ...
Страница 329: ...APPLIED OPERATIONS Viewing 3D Image 2 219 Page Fig 2 107 Panel Showing 3D Image to be Viewed Through Color Eyeglasses ...
Страница 396: ......
Страница 402: ......
Страница 414: ......
Страница 420: ......
Страница 426: ......
Страница 428: ......
Страница 430: ......
Страница 458: ......
Страница 460: ......
Страница 462: ......
Страница 468: ......
Страница 469: ......