30
a
b
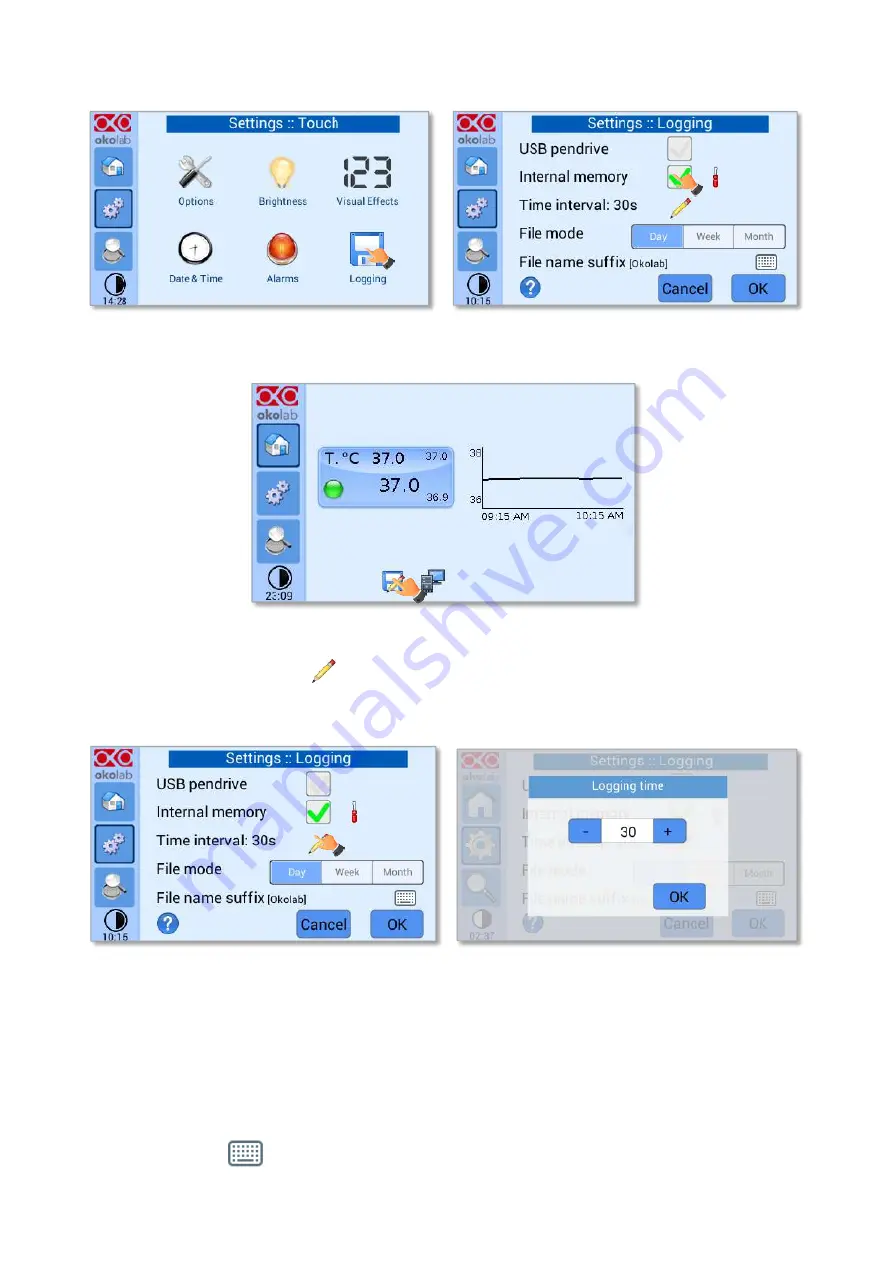
Figure 41. Logging. (a) How to enter in the logging menu; (b) logging in internal memory
Figure 42. How to access the Logging page from the Homepage
3.
Press on the icon
(see Figure 43 a) to insert the
Time Interval
i.e. the frequency with which
you want to record a data point, as shown in Figure 43 b. In this example a data point is logged
every 30 seconds, you can change
Time Interval
in the range 1-60 seconds.
a
b
Figure 43. How to set the logging time (a
–
b)
4.
Choose how you want to organize the data when downloaded, by pressing on Day, Week or
Month, see Figure 43 (a).
Tip
►
If you select Day, the data will be split in files, each one containing the data of one day. If you select
Week, the data will be split in files, each one containing the data of one week.
5.
Write the file name suffix to be reported in the downloaded files by pressing on the keyboard
icon
, see Figure 44 a.


