17
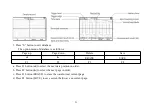
corresponding frequency i.e. measurement of pulse width or cycle/frequency of signals.
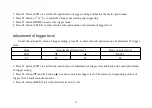
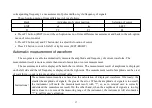
The sub-option menu of time difference (
t) is as follows:
Back
Adjustment of cursor position
Selection of cursor
EXIT
◀
▶
LEFT
F1
F2
F3
F4
a. Press F1 button (EXIT) to exit the sub-option menu of time difference measurement and back to the sub-option
menu of cursor control.
b. Press F2 button (
◀
) and F3 button (
▶
) to adjust the location of cursor.
c. Press F4 button to switch for left or right cursor (LEFT/RIGHT)
Automatic measurement of waveform
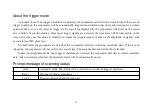
The scopemeter is able to automatically measure the amplitude and frequency of current waveform. The
measurement result is more accurate than visual observation or cursor measurement.
The measurement result is displayed beneath the waveform. The measurement result of amplitude is displayed
on the left side and that of frequency is displayed on the right side. The measurement result of amplitude can be crest
of waveform----peek value, mean value or virtual value.
Instructions!
These measurement results are based on the calculation of displayed waveform. Obviously, the
smaller the amplitude of signals, the greater the error. When the amplitude of signals is too small,
the instrument will mark the measurement result with “?”, so as to remind user to correctly
understand the measurement result. On the other hand, when the amplitude of signals is too big
and is close to or exceeds the measuring range of the instrument, the instrument will also mark a
“?” to call for user’s attention.


