DEBUG MONITOR COMMANDS
M68CPU32BUG/D REV 1
3-60
T
Trace
T
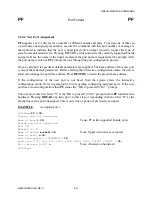
3.30 TRACE
T [<count>]
Use the T command to execute one instruction at a time and display the target state after
execution. T starts tracing at the address in the target PC. The optional count field specifies the
number of instructions to be traced before returning control to CPU32Bug. The count field
default is 1. As each instruction is traced, a register display printout is generated.
During tracing, breakpoints in ROM or write protected memory are monitored (but not inserted)
for all trace commands which allow the use of breakpoints in ROM or write protected memory.
Control is returned to CPU32Bug if a breakpoint with 0 count is encountered.
Trace functions are implemented with the trace bits (T0, T1) in the MCU device status register.
Do not modify trace bits (T0, T1) while using the trace commands. Because the trace functions
are implemented using the hardware trace bits in the MCU, code in ROM can be traced. During
trace mode, breakpoints are monitored and their counts decremented when the corresponding
instruction with breakpoint is traced. This allows breakpoints to work in ROM, but only in the
trace mode.
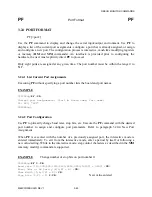
EXAMPLE
The following program resides at location $7000.
CPU32Bug>MD 7000;DI<CR>
00007000 2200
MOVE.L
D0,D1
00007002 4282
CLR.L
D2
00007004 D401
ADD.B
D1,D2
00007006 E289
LSR.L
#$1,D1
00007008 66FA
BNE.B
$7004
0000700A E20A
LSR.B
#$1,D2
0000700C 55C2
SCS.B
D2
0000700E 60FE
BRA.B
$700E
CPU32Bug>
Initialize PC and D0:
CPU32Bug>RM PC<CR>
PC =00008000 ? 7000.<CR>
CPU32Bug>RM D0 <CR>
D0 =00000000 ? 8F4IC.<CR>
Содержание M68CPU32BUG
Страница 16: ...GENERAL INFORMATION M68CPU32BUG D REV 1 1 8 ...
Страница 30: ...DEBUG MONITOR DESCRIPTION M68CPU32BUG D REV 1 2 14 ...
Страница 102: ...DEBUG MONITOR COMMANDS M68CPU32BUG D REV 1 3 72 ...
Страница 168: ...DIAGNOSTIC FIRMWARE GUIDE M68CPU32BUG D REV 1 6 24 ...

