DEBUG MONITOR DESCRIPTION
M68CPU32BUG/D REV 1
2-1
CHAPTER 2
DEBUG MONITOR DESCRIPTION
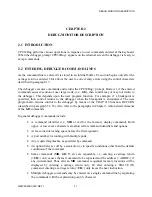
2.1 INTRODUCTION
CPU32Bug performs various operations in response to user commands entered at the keyboard.
When the debugger prompt CPU32Bug> appears on the terminal screen the debugger is ready to
accept commands.
2.2 ENTERING DEBUGGER COMMAND LINES
As the command line is entered it is stored in an internal buffer. Execution begins only after the
carriage return is entered. This allows the user to correct entry errors using the control characters
described in paragraph 1.7.
The debugger executes commands and returns the CPU32Bug> prompt. However, if the entered
command causes execution of user target code, (i.e., GO), then control may or may not return to
the debugger. This depends upon the user program function. For example, if a breakpoint is
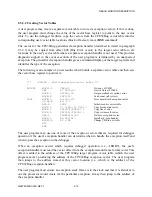
specified, then control returns to the debugger when the breakpoint is encountered. The user
program also returns control to the debugger by means of the TRAP #15 function, RETURN
(described in paragraph 5.2.16). Also refer to the paragraphs in Chapter 3 which detail elements
of the GO commands.
In general debugger commands include:
•
A command identifier (i.e., MD or md for the memory display command). Both
upper- or lower-case characters are allowed for command identifiers and options.
•
At least one intervening space before the first argument.
•
A port number for running with multiple ports.
•
Any required arguments, as specified by command.
•
An option field, set off by a semicolon (;) to specify conditions other than the default
conditions of the command.
•
Some commands (MD, GO, T, etc) are repeatable, i.e., entering a carriage return
(<CR>) only causes the last command to be repeated and the address (<ADDR>), if
any, incremented. Thus after an MD command, sequential memory locations will be
displayed by entering a carriage return only. Or after entering a TRACE (T)
command, entering a carriage return (<CR>) only traces the next instruction.
•
Multiple debugger commands may be entered on a single command line by separating
the commands with the explanation point (!) character.
Содержание M68CPU32BUG
Страница 16: ...GENERAL INFORMATION M68CPU32BUG D REV 1 1 8 ...
Страница 30: ...DEBUG MONITOR DESCRIPTION M68CPU32BUG D REV 1 2 14 ...
Страница 102: ...DEBUG MONITOR COMMANDS M68CPU32BUG D REV 1 3 72 ...
Страница 168: ...DIAGNOSTIC FIRMWARE GUIDE M68CPU32BUG D REV 1 6 24 ...

