P A G E 25
U N I C O D E G R I P
U S E R M A N U A L
S
WO
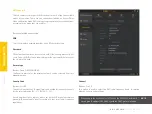
5.1.2 SWO Trace (ARM Cortex M)
SWO (Serial Wire Output) trace is used to display various SWO-related
messages in the Menu item section of the CODEGRIP Suite. The ARM SWO
trace port uses a single pin to stream out data packets over 32 different
ports, using the specified clock rate. The SWO is a part of the ARM
®
CoreSight Debug module which is incorporated in most of the MCUs based
on the Cortex
®
-M3, M4, and M7 core. It is perfectly suited to output debug
and runtime information and monitor the performance of the application
in real time, without using processing resources, and without the need for
complex coding routines.
To simplify working with the SWO trace port, Mikroe has provided the
SWO library with ready-made functions, which can drastically speed up
the software development. The library is available for download from the
Libstock at
libstock.mikroe.com
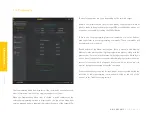
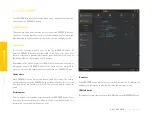
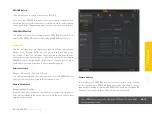
Monitoring Interval
The monitoring interval can be specified in this text field. The collected
SWO messages will be displayed on the lower part of the
Menu item
section after the specified monitoring interval expires. If the internal buffer
becomes full, an overflow error message will be displayed. In that case, the
monitoring interval should be decreased.
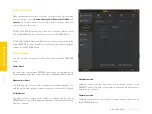
Baud Rate
The baud rate of the SWO Trace clock can be specified in this text field.
It needs to be matched with the baud rate used in the SWO software,
running on the target MCU. Otherwise, SWO data might get corrupted and
the messages might not be displayed at all. To change the baud rate, the
Monitoring Status
needs to be paused.
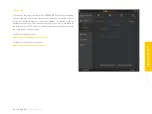
Monitoring Status
Options:
Paused, Active
When
Paused
, the SWO trace messages will not be collected and displayed on
CODEGRIP Suite GUI. When set to
Active
, the SWO monitoring will be resumed.
Содержание CODEGRIP UNIVERSAL
Страница 4: ......
Страница 14: ...C O D E GRIP...
Страница 17: ......
Страница 29: ...Dark or Light it s your choice...


