


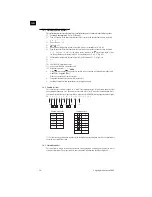
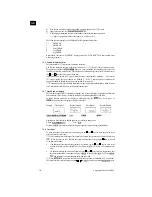

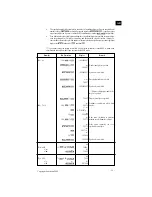

1.2.2 About the display layout
The display consists of a dot area for graphing, as well as an area for indicators and characters. you
can monitor the status of the calculator and programs by viewing the display.
Example:
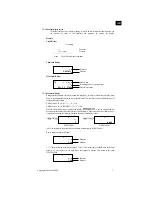
Graph Display
Coordinates
Exponent
Mantissa
Graph
Shows Trace function coordinates
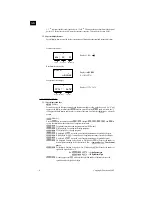
Calculation Display
Mode Status Display
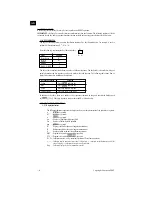
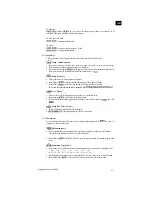
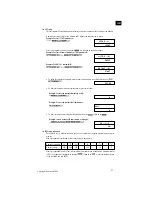
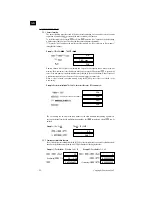
1.2.3 Exponential display
During normal calculation, this unit is capable of displaying up to 10 digits. Values that exceed this limit,
however, are automatically displayed in exponential format. You can choose between 2 different types of
exponential display formats.
NORM 1 mode : 10
-2
(0.01) >
x
,
x
≥
10
10
NORM 2 mode : 10
-9
(0.000000001) >
x
,
x
≥
10
10
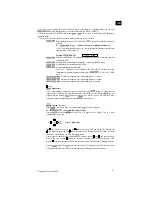
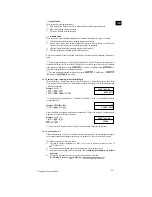
Selection of these modes can be carried out by pressing , when no specification has
been made for the number of decimal places or significant digits. The present status is not displayed, so it
is necessary to perform the following procedure to specify either display format:
(All of the examples in this manual show calculation results using the NORM 1 mode.)
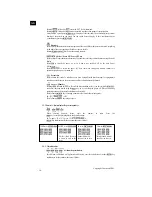
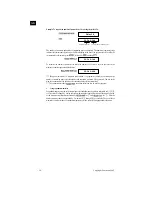
How to interpret exponential format ?
1.2
11
indicates that the result is equivalent to 1.2x10
11
. This means that you should move the decimal
point in 1.2 eleven places to the right. Since the exponent is positive. This results in the value
120,000,000,000.
Copyright L
EXIBOOK
2002
- 7 -
GB
LR
D WRT
360
PO_2_3_5789
D
-11
2.052631
Exponent
Mantissa
Exponent
Mantissa
Mode Status
Remaining number of program steps
Program area status
D
-03
5.
D
0.005
MODE
9
EXE
÷
EXE
1
200
÷
EXE
200
NORM 2 mode
NORM 1 mode
D
11
1.2
Exponent
Mantissa
D
-03
1.2
Содержание GC1000i
Страница 1: ...GB INSTRUCTION MANUAL GRAPHIC CALCULATOR GC500i GC1000i...
Страница 2: ...GB Copyright LEXIBOOK 2002...