


Copyright L
EXIBOOK
2002
- 43 -
GB
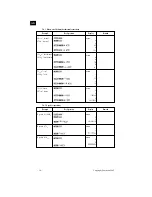
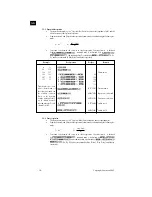
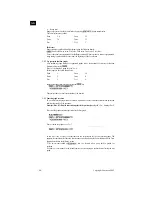
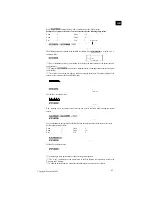
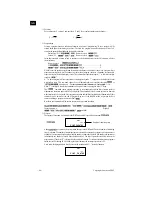
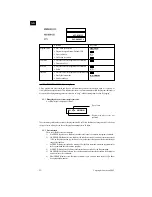
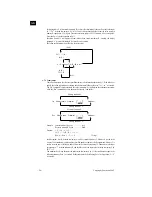
Example: To use the Trace function in combination with the Zoom function to analyze the
graph for y=x
2
-3. Use the following range parameters for the original graph (seven significant
digits specified).
Xmin
:
-4
Ymin
:
-8
Xmax
:
4
Ymax
:
8
Xscl
:
2
Yscl
:
4
After specifying the range parameters, graph y=x
2
-3.
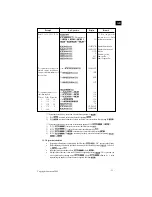
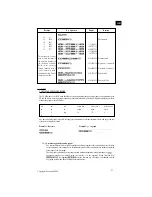
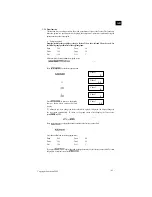
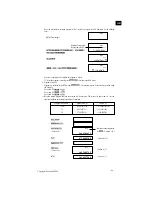
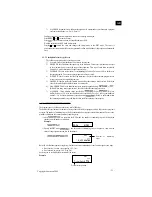
3
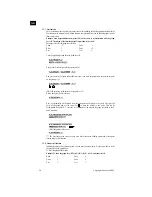
Activate the Trace function
Use or to move the pointer along the graph. Each press moves the cursor one point.
Move the pointer to the point where the graph intersects the x-axis and press
to display
x-coordinate value.
Press
to change the coordinate display to show the y-coordinate.
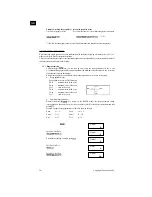
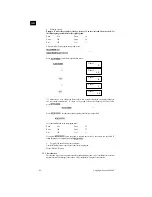
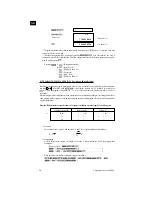
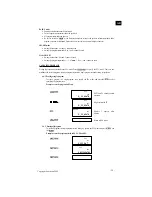
Now use the Zoom function to enlarge the graph. First specify a factor of 2 on the x- and y-axes.
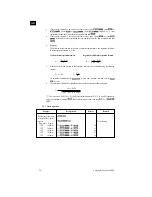
2
*** Whenever you try to change the factor value while a graph is displayed, the display changes to the text
screen automatically. To return to the graph screen after changing the factor value, press
.
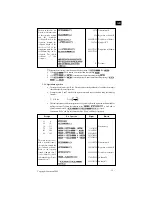
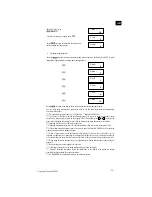
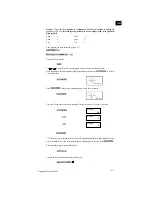
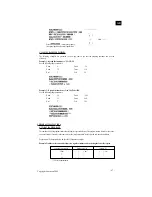
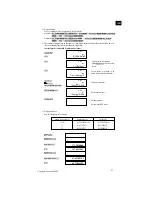
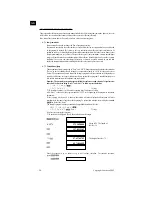
Now enlarge the graph according to the factors.
Activate the Trace function and move the pointer again.
Graph
Trace
x
2
EXE
X
ALPHA
-
EXE
SHIFT
Cls
SHIFT
Value
SHIFT
Value
SHIFT
X
↔
Y
SHIFT
X
↔
Y
EXE
EXE
SHIFT
Factor
Xfact?
1.5
Yfact?
2.
Xfact?
2.
SHIFT
Factor
SHIFT
Zoom xf
Trace
SHIFT
X
↔
Y
SHIFT
Factor
- 0.287197231
- 1.647058824
Содержание GC1000i
Страница 1: ...GB INSTRUCTION MANUAL GRAPHIC CALCULATOR GC500i GC1000i...
Страница 2: ...GB Copyright LEXIBOOK 2002...