


Copyright L
EXIBOOK
2002
- 37 -
GB
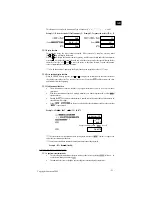
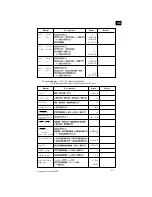
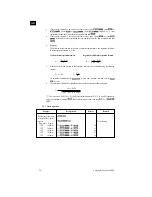
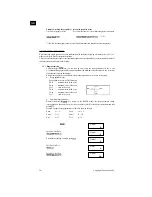
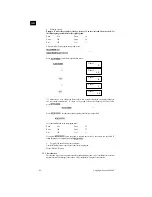
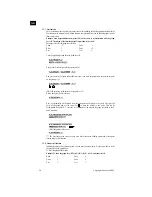
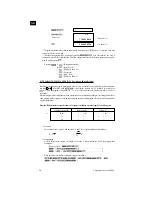
Example
xi
yi
28
2410
30
3033
33
3895
35
4491
38
5717
The data in the above can be
used to obtain the terms of
the regression formula and
the correlation coefficient.
Based on the regression
formula, estimated value y
can be obtained for xi=40,
and estimated value x can be
obtained for yi=1000.
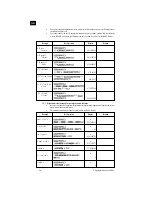
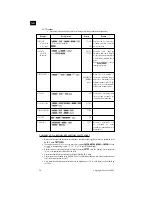
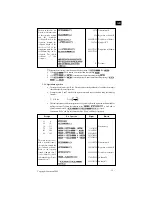
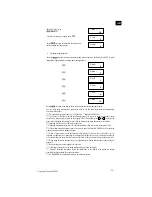
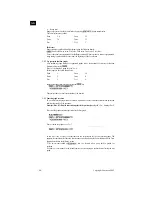
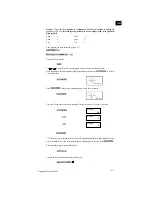
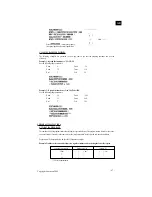
Key Operation
28
2410
30
3033
33
3895
35
4491
38
5717
40
1000
^
^
÷
MODE
Display
3.33220451
3.401197382
3.496507562
3.555348062
3.63758616
0.238801069
2.771866156
0.998906253
6587.674787
20.26225681
Remark
Clear memory
Constant term A
Regression coefficient B
Correlation coefficient r
y when xi=40
x when yi=1000
EXE
SHIFT
Scl
EXE
EXE
SHIFT
B
EXE
R
SHIFT
In
DT
SHIFT
,
In
DT
SHIFT
,
In
DT
SHIFT
,
In
DT
SHIFT
,
In
In
DT
SHIFT
,
EXE
SHIFT
SHIFT
y
^
Ans
e
x
SHIFT
EXE
In
EXE
SHIFT
SHIFT
x
^
Ans
e
x
SHIFT
e
x
EXE
A
SHIFT
SHIFT
^
^
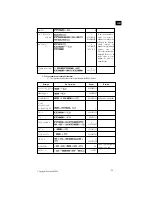
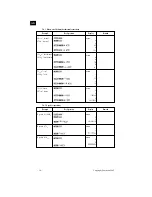
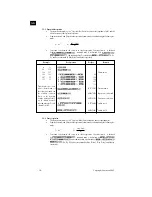
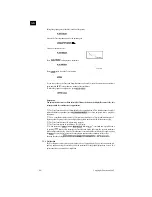
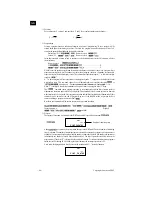
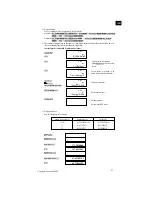
3. GRAPHS
3.1 BUILT-IN FUNCTION GRAPHS
The COMP mode of the RUN mode should be used when graphing function. Some graphs can be produced in the
SD and LR modes, but certain graphs cannot be produced in these modes. The BASE-N graphs making it possible to
produce the graphs of basic functions.
sin
cos
tan
arcsin (sin
-1
)
Arcos (cos
-1
)
Arctan (tan
-1
)
sh
ch
th
argsh
argch
argth
√
−
x
2
log
ln
10
x
e
x
X
-1
3
√
−
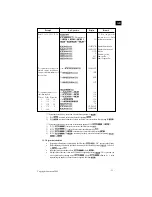
Any time a built-in graph is executed, the ranges are automatically set to their optimum values, and any graph pre-
viously on the display is cleared.
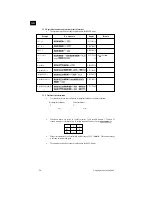
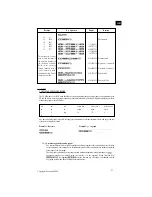
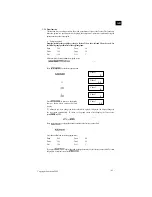
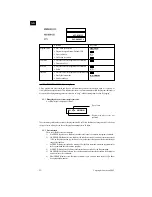
Example 1: Sine curve
Example 2: y = 1/x graph
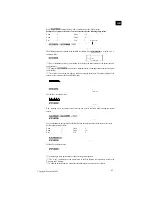
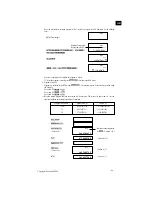
3.1.1 Overdrawing built-in function graphs
Two or more different built-in function graphs can be drawn together on the same display. Since the range
for the first graph is automatically set, all subsequent graphs on the same display are produced according
to the range of the first graph.
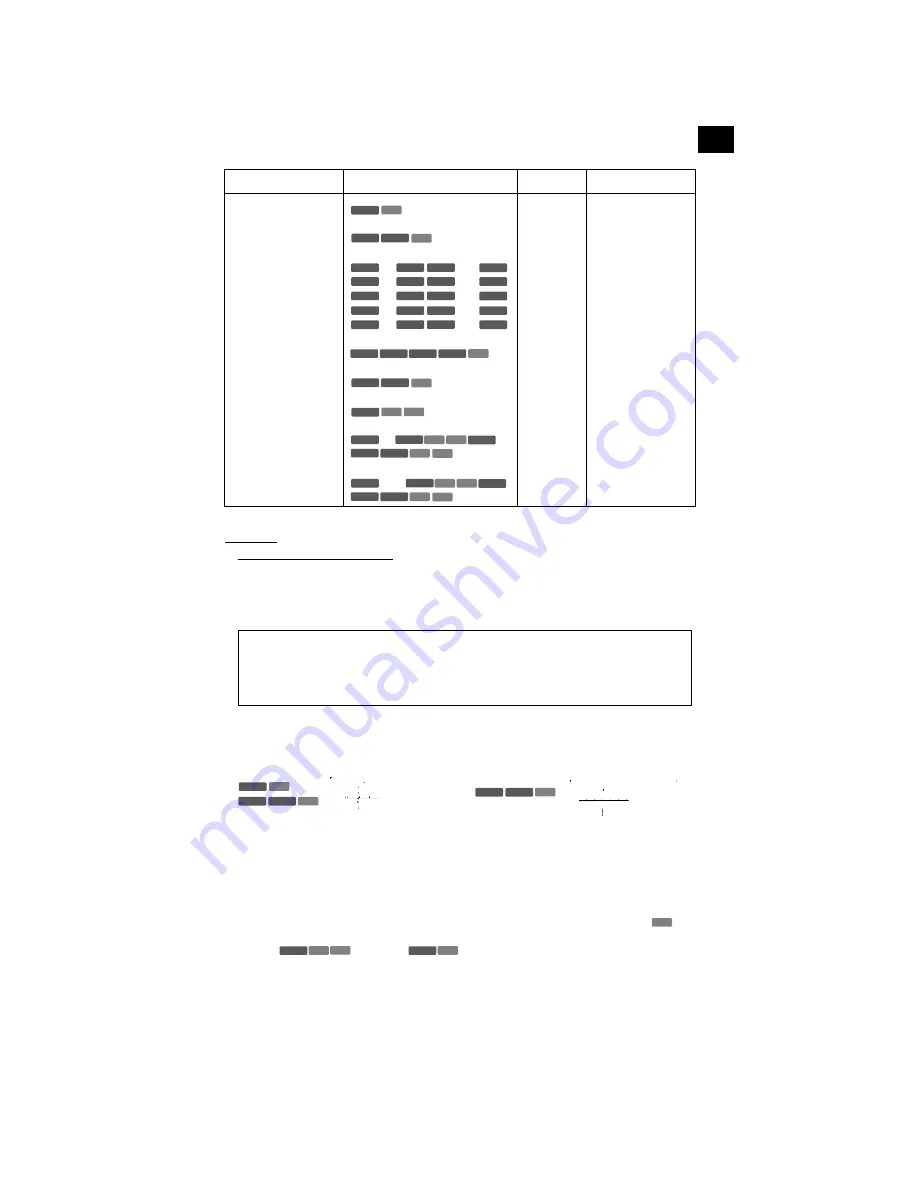
The first graph is produced by using the previously mentioned operation (Graph [function key]
).
Subsequent graphs are produced using the variable x in the operation Graph [function key]
. By inputting
after the function key, the range is unchanged and the
next graph is produced without clearing the existing display
+
MODE
Graph
sin
EXE
Graph
x
-1
EXE
EXE
X
ALPHA
EXE
X
ALPHA
Содержание GC1000i
Страница 1: ...GB INSTRUCTION MANUAL GRAPHIC CALCULATOR GC500i GC1000i...
Страница 2: ...GB Copyright LEXIBOOK 2002...