


- 42 -
Copyright L
EXIBOOK
2002
GB
●
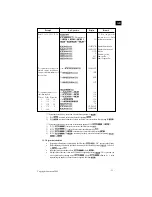
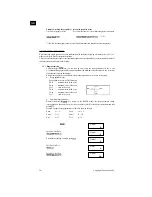
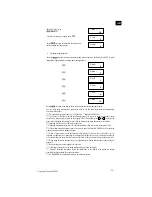
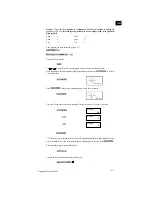
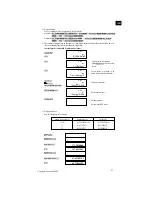
Reducing a graph
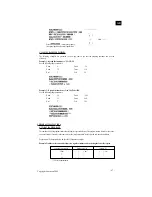
Example: To reduce the graph for y=sinx by a factor of 1.5 on the x-axis and 2.0 on the y-axis. Use
the following range parameters for the original graph.
Xmin
:
-360
Ymin
:
-1.6
Xmax
:
360
Ymax
:
1.6
Xscl
:
180
Yscl
:
1
After specifying the range parameters, graph y=sinx.
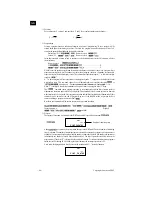
Press
for the factor specification screen.
1.5
2
*** whenever you try to change the factor value while a graph is displayed, the display changes to
the text screen automatically. To return to the graph screen after changing the factor value,
press .
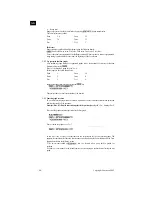
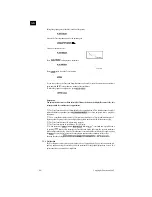
Press
to reduce the graph according to the factors you specified.
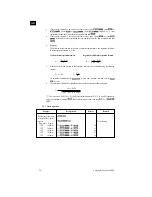
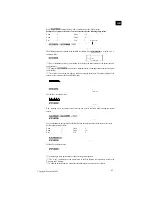
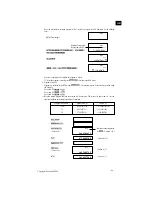
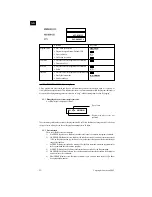
Let’s take another look at the range parameters.
Xmin
:
-540
Ymin
:
-3.2
Xmax
:
540
Ymax
:
3.2
Xscl
:
180
Yscl
:
1
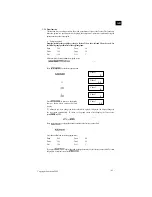
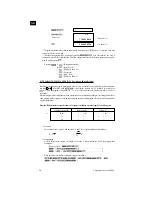
If you press
again, the graph is reduced once more by the factors you specified. To
return the graph to its original size, press
.
●
To specify the zoom factors within a program
Use the following format to specify the zoom factor in a program.
Factor (Xfactor), (Yfactor)
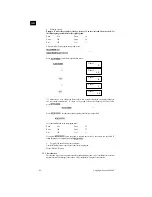
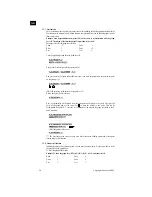
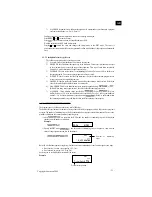
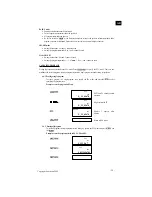
3.2.5 Trace function
This function lets you move a pointer around a graph and display the x- and y- coordinates of the current
pointer location. You enlarge or reduce the x- and y- coordinates. Using the Trace function.
Graph
sin
EXE
X
ALPHA
Xfact?
2.
Xfact?
1.5_
Yfact?
0.
Yfact?
2_
Xfact?
1.5
EXE
EXE
SHIFT
Factor
SHIFT
Factor
SHIFT
Factor
SHIFT
Factor
EXE
SHIFT
Cls
SHIFT
Zoom xl/f
SHIFT
Zoom xl/f
SHIFT
Zoom xl/f
SHIFT
Zoom org
Содержание GC1000i
Страница 1: ...GB INSTRUCTION MANUAL GRAPHIC CALCULATOR GC500i GC1000i...
Страница 2: ...GB Copyright LEXIBOOK 2002...