56
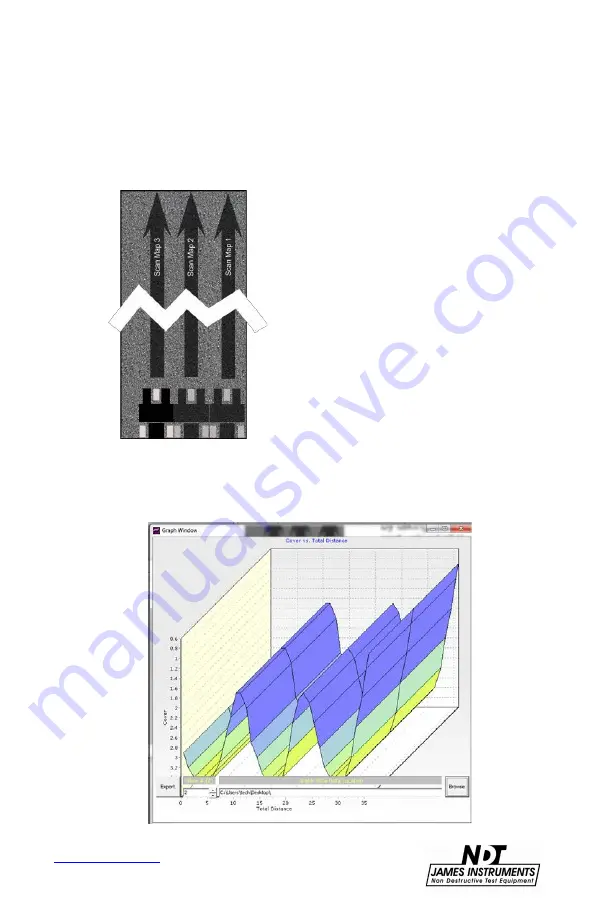
2. 3D representation:
The 3D representation helps to show multiple Scan Maps
in one graph, to use this feature; first it requires storing
several Scan Maps (minimum two).
As shown in the figure to the
left, by taking several scan
readings, and upload all the
Scan Maps to the computer,
the 3D option will arrange
these maps to generate a 3D
graph showing the peaks that
represents the existence of a
rebar and valleys that
correspond to absence of
rebar, also a color code is
implemented that shows a
rebar in the dark blue area of
the graph and the empty areas
are in green or orange color.
Fig.60
Содержание Rebarscope R-C-400
Страница 1: ...R C 400 R C 450 R C 410 Rebarscope Operator s Manual Original Instructions Revision July 2018 ...
Страница 12: ...7 www ndtJames com Menu Layout Figure 3 Rebarscope Function Flow Chart ...
Страница 23: ...18 www ndtJames com Figure 12 3 8 Spacer with L Shaped Template Figure 13 Locating Rebar with Spacer ...
Страница 24: ...19 www ndtJames com Figure 14 Analyzing Data ...


