4
RECORDING MANAGEMENT
4
RECORDING MANAGEMENT
4.2 Recordings
4.2 Recordings
and 4.3 Rules chapters). The menu
Recordings
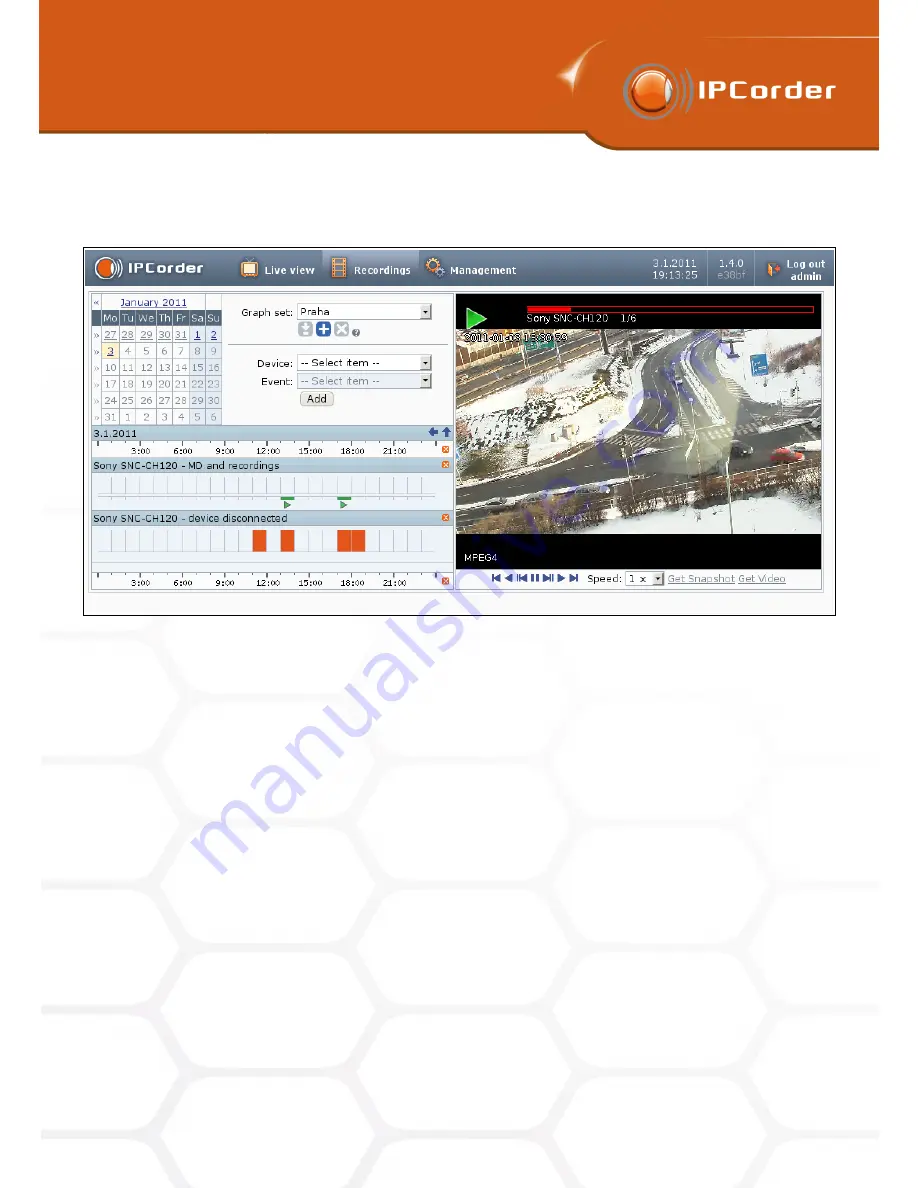
(Figure 25) serves for browsing and viewing the recorded
videos and data.
Figure 25: Recordings
In the calendar on the left side of the page, choose the period of time in which you want to search. You can
either choose one day, a week (by clicking on the arrow on the left side of the dates) or a month (by clicking on
its name).
Then it is necessary to choose the device and the type of event you want to display. When this is done, the
system automatically displays the statistics for the given period. It is possible to display graphs for multiple
events at once (add another graph by simply choosing another device and event).
Click the
Delete button
located right from the label of the graph to remove the one particular graph, or the
Delete button
at the time axis to remove all graphs at once.
The displayed graphs constitute a so-called
Graph Set
. This set can be saved by clicking the
Add button
(blue
plus) located under the
Graph Sets menu
. This button activates a naming dialogue. To display an already
saved graph set, click its name in the aforementioned menu. The
Save button
(a green arrow) serves for saving
changes in the active graph set and the
Delete button
(a red cross) for removing the active set. Apart from
graph sets, the
Graph Sets
menu also contains the user-defined views. Choosing one of them will display
motion detection graphs from the devices belonging to the particular view.
The time axis, displayed right above the graphs, serves for easier orientation when reading the graphs. Holding
the cursor over the coloured bar of the graph will display the time period it represents. For an event graph,
the height of each bar corresponds to the frequency of the event’s occurrence. For a value graph, the bar
represents the average value in the given time period.
34
Содержание KNR-090 4
Страница 1: ......
Страница 2: ...IPCorder User Manual 1 4 Copyright c KOUKAAM a s 2011...


