9
⑤
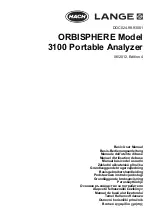
Sample code setting
When several samples is need to be measured, the samples can
be coded (figure 4-12). The value of setting position will increase 1
by one pressing of button “UP”. The position shift to the next
position
“DOWN”
by one pressing of button
. The coded range is
00-99. When the date saved, the sample code saved too. The
samples number corresponding to the data can be printed (figure
7-2). It also can be looked up during data browsing (figure4-21).
Fig 4-12
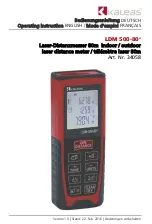
3) System setting
Under system setting menu, the date/time, backlight time, on or off of
key sound, on or off of alarm sound can be set.
Fig 4-13
Fig 4-14
①
Date/time setting
Under this menu, year, mnth, day, hour, minute, second can be
set. The selection will increase 1 by one pressing of button “UP”.
return to 1 when it exceeds the range. The continuous
It will
1 can be realized by long pressing of the button “UP”.
increasing of
will shift to the next one by press button “DOWN”.
The selection
confirmed by press button “OK” .The setting will
The setting will be
button “RETURN”.
be aborted by press
8
③
Tolerance limit setting
Under this menu, the tolerance limit can be set. When the
measuring data is exceed the setting value, the icon of “!” will be
showed on the LCD and it will flash. If the alarm function is turn
on, the durometer will make the alarm sound.
④
Gross error handling ON/OFF setting
Under this menu, the gross error handling can be set to on or off
during the measuring process. (the gross error handling is available
only under the average mode and maximum average mode ). If the
gross error handling function is turn on, the gross error analysis will
be applied to the current group when a statistic group is formed(the
measure times meet the setting time),and the gross error data will
be taken as invalided data to be abandoned during the calculating
of average value and peak difference. If the auto-print function is
turn on, a symbol of “!” will be marked after the gross error data. If
the gross error handling function is turn off, the gross error analysis
will not be carried out after the statistic group is formed, all data of
the statistic group will be taken as valid value to calculate the
average value and peak difference.
Fig 4-10
Fig 4-11
Fig 4-9
Содержание ISH-DSD
Страница 1: ...ISH DSD www insize com OPERATION MANUAL DIGITAL SHORE DUROMETER MN ISH DSD E V0...
Страница 2: ......