Recordings
HMG 4000
Edition 2016-03-08 - V01 R04
[74]
Part No.: 669950
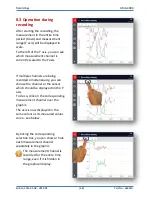
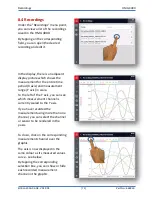
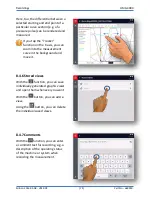
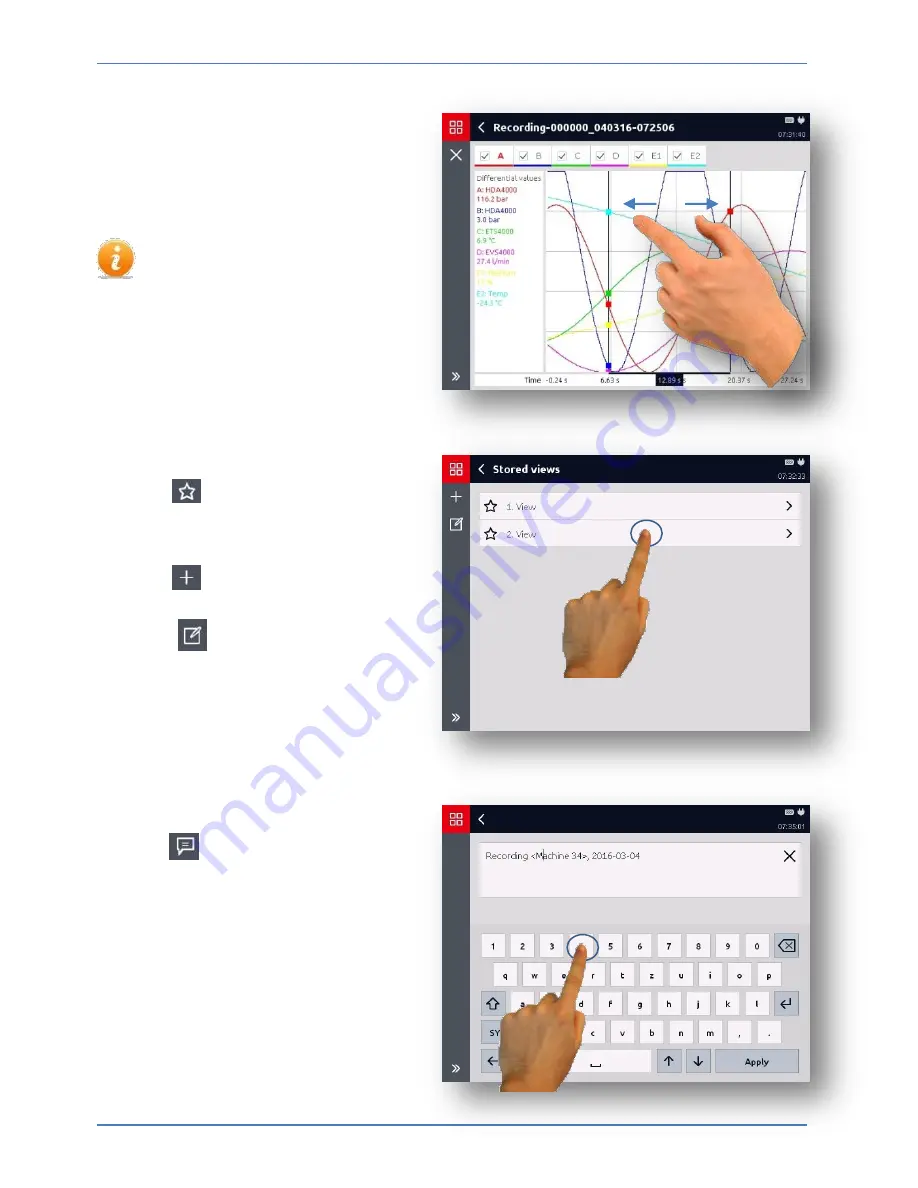
Here, too, the differential between a
selected starting and end point of a
particular curve section (e.g. of a
pressure pulse) can be rendered and
measured.
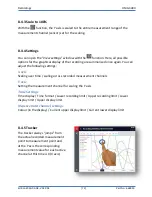
If you tap the "
Tracker
"
function on the X axis, you can
zoom into the measurement
curve in the background and
move it.
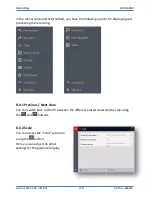
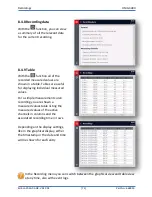
8.4.6 Stored views
With the
function, you can save
individually generated graphic views
and open them whenever you want.
With the
button, you can add a
view.
Using the
button, you can delete
the individual saved views.
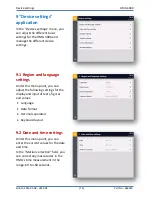
8.4.7 Comments
With the
function, you can enter
a comment text for recording, e.g. a
description of the operating status
of the machine or system when
recording the measurement.

