


17 / 27
User defined multiplier (P22),
Correction factor (measured/actual)
0.
7…10
Adjusts the transmitted quantity by distance. If the value measured by the device differs from the
value under real conditions, this multiplier can be used to adjust the result. The output value is
multiplied by the number set here. The default multiplier is 1, which does not change the output.
HyView setting:
“Device settings” > “Measurement optimalization” > “Velocity user correction factor”
VGF-DISPLAY:
no adjustment available
1
Gross tank volume (P47)
0…999 999
If the output (PV source) is set to
“Ullage volume” transmission, the total volume can be specified in
this parameter to calculate the actual transmitted value. In this case, the transmitted data is the
difference between the total volume and the actual volume of the medium. Its unit is PV.
HyView setting
: “Device settings” > “Tank/Silo parameters” > ”Total tank volume”
VGF-DISPLAY:
no adjustment available
0
5.1.2.2
Setting Up and Filling the OC (Output Conversion) Table
This feature is required to create a level / volume conversion table of up to twenty points. Each new value entered must be greater than the previous one.
The length and volume units can be changed later without changing the data in the table (length unit, volume unit).
The two units on the right and left of the table are given by the length unit and volume unit settings, i.e., these two units must be used to complete the table (length
unit and volume unit).
Important:
Volume can only be measured if a conversion table is created!
To fill or adjust the device level / volume
table, go to the “Device Setup”> “OC
-
table” tab in
HyView.
Here you can fill or modify the table.
The difference is that if the “Measurement mode PV source” parameter is set to “Volume” or “Ullage Volume”, the OC table is a
ctive.
When the appropriate chan
ges have been made to the table or it has been filled in correctly, click the “Send” button under the “Get” button on the rig
ht on this page
(“OC
-
table” tab) to download the table.
5.1.2.3
Device status window
To turn on the “Device status window” in
HyView, right-
click on the device line in the “Device list” list in the main window and select “Show Device Status Window” in
the popup window.
5.1.2.4
Device “Echo Diagram” (Oscilloscope Function)
Open the “Echo Diagram” window to display the
device echo diagram.
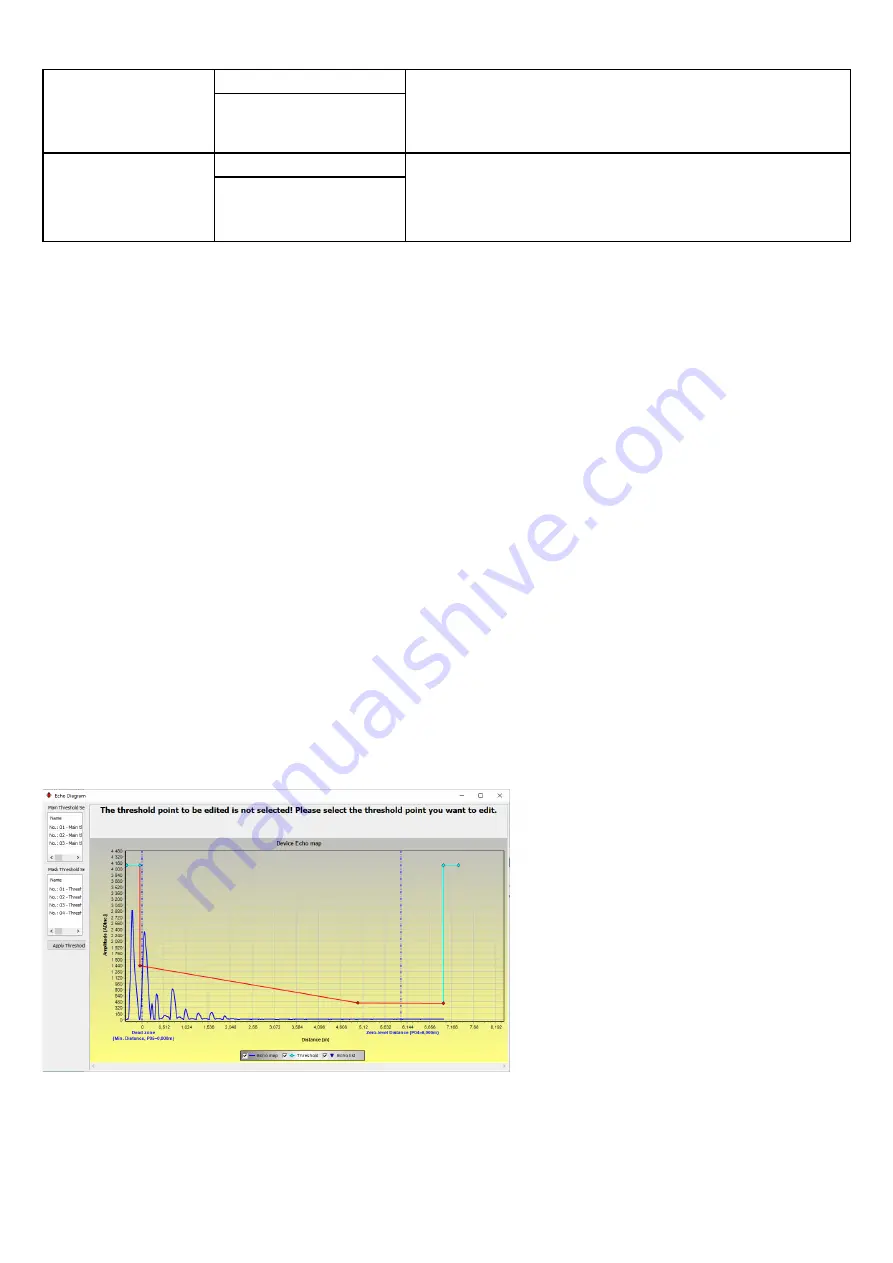
The “Device Echo map” window will appear. The diagram shows the reflection curve measured by the device.
Press the “Refresh” button in the bottom row of the window (or press the F4 button while in the window) to refresh the chart
or read the data. After a successful
reading, a curve corresponding to the image below will appear on the graph (see Figure 1).
If there was an evaluable level signal, it will also appear on the graph (“Selected peak” bubble window) along with other add
itional information. In addition, you can
use this window to set any “Threshold” level.
5.1.2.5
Level Threshold
The level threshold of the device can be changed in the echo diagram window, i.e., the value of “Threshold.”
This may be necessary if the device does not find the level signal (e.g., the set level threshold is too high or too low and the gain is already at the highest level).
To change the “Threshold” value, access the “Threshold settings”> “Threshold edit enable” function from the pop
-up menu triggered by a right-click. The corner
points of the threshold curve on the echo diagram can then be adjusted with the mouse. Pressing the “Apply Threshold” button
on the left help panel will apply the
set threshold value. To refresh the chart, press the “Refresh” butt
on (or press the F4 button in the window).
Attention!
The “Cursor On” function does not give an exact
value, it only recalculates the value of the given point based on
the graphical representation.


