HP E5200A Скачать руководство пользователя страница 94

Using the Analyzer

To Simulate Traffic

2-46

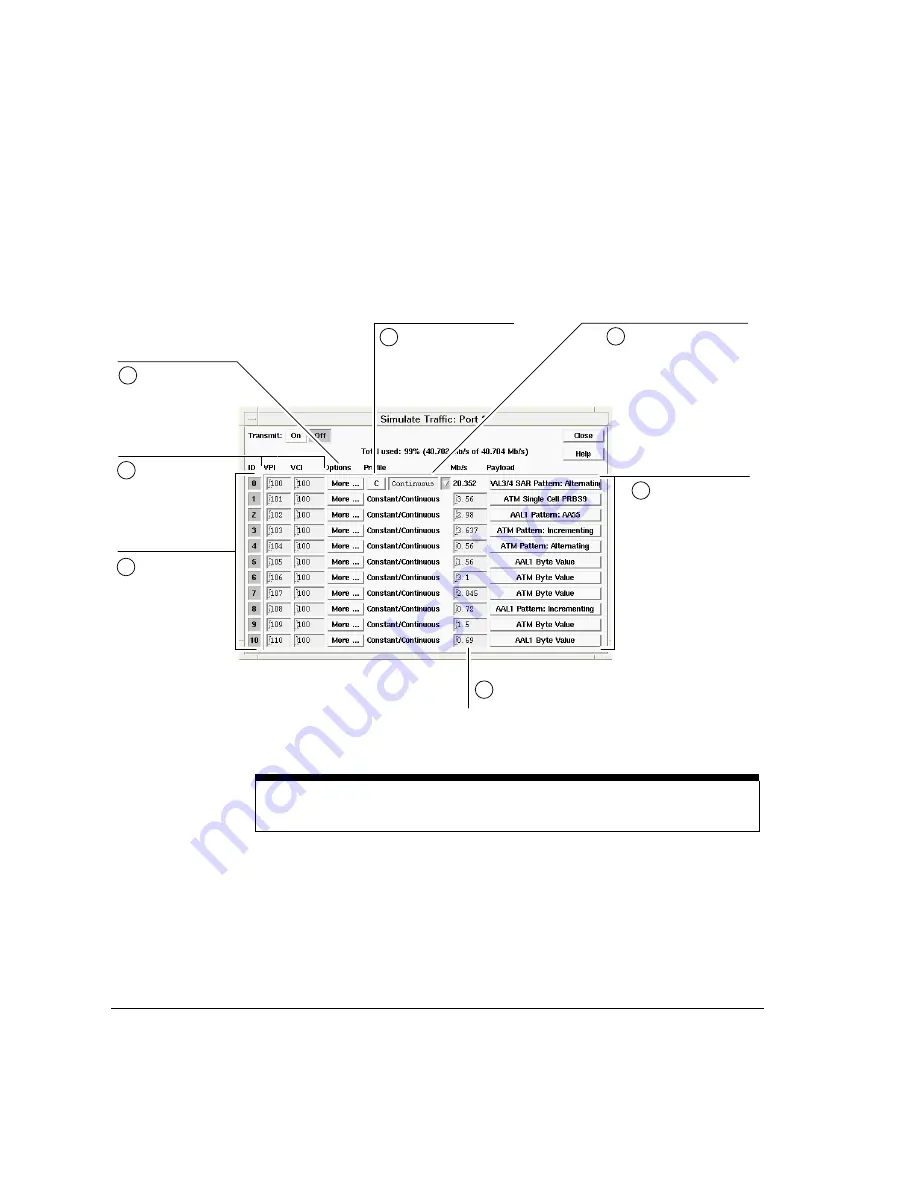
To Simulate Traffic from the Traffic Generator

Use the Hexadecimal to ASCII conversion table when editing PDUs and
transmitting byte values. See “Hexadecimal to ASCII Conversion” on
page A-2.

Note

If you select single cells, when you click the Transmit On button a Transmit button

appears. Click the Transmit button to transmit a single cell.

3

Edit the encode
options for each
channel if required.

1

Select the
channels on
which you want
to transmit data.
Channel 0 is the
foreground
channel, and
channels 1—10
are background
channels.

2

Enter the VPI/VCI
for each channel.

5

Select to transmit data
continuously or as single
cells for the foreground
channel.

4

Set the traffic profile
and bandwidth for the
foreground channel.

6

Set the bandwidth for
the background channels.

7

Specify the type of
payload for each
channel.

Содержание E5200A

Страница 1: ...H Broadband Service Analyzer User s Guide ...

Страница 2: ...Intel Corporation New editions of this guide are issued to reflect extensive changes made to the software Revisions may be issued between application releases to correct errors in the manual There may not be a new edition issued in conjunction with every application release The application release at the date of printing is noted in the following table Notice Warranty Trademarks Acknowledgments Pr...

Страница 3: ...and Service Analyzer hard ware has a three year return to HP Service Centre warranty commencing at delivery date type 7A The HP Broadband Service Analyzer soft ware and firmware has a 90 day replace ment warranty commencing at delivery date type 3C Limitation of Warranty The foregoing warranty shall not apply to defects resulting from improper or inade quate maintenance by Buyer Buyer sup plied pr...

Страница 4: ...tection features built into this product have been impaired either through physical damage excessive moisture or any other reason REMOVE POWER and do not use the product until safe operation can be verified by service trained personnel If necessary return the product to a Hewlett Packard Sales and Service Office for service and repair to ensure the safety features are maintained DO NOT substitute ...

Страница 5: ...l Par conséquent le service et l ajustement doivent être effectué unique ment par une personne qualifiée Ne remplacez pas de composantes lorsque le cordon d alimentation est sous tension Il pourrait y avoir présence de tension dan gereuses même lorsque l appareil est déconnecté Manipulation du tube cathodique Une manipulation brusque ou le fait de secouer l appareil peut provoquer le bris du tube ...

Страница 6: ...lass A 1 EN 50082 1 1992 IEC 801 2 1991 4 kV CD 8 kV AD IEC 801 3 1984 3 V m IEC 801 4 1988 0 5 kV Signal Lines 1 kV Power Lines Supplementary Information This product herewith complies with the requirements of the Low Voltage Directive 73 23 EEC and the EMC Directive 89 336 EEC This product uses high speed digital interfaces which are susceptible to Electrostatic Discharge ESD ESD may corrupt rec...

Страница 7: ...easure the key indicators of the health of the link or of a specific channel VPI VCI and display the information in an easy to read summary format SMARTtests and predefined macros speed up the common and routine tasks you need to perform when installing and testing network equipment and services and to ensure quality of service Simulator gives you all of the tools you need to have manual control o...

Страница 8: ...ns on how to set up and install the analyzer users who are responsible for the initial setup and any subsequent relocation of the analyzer User s Guide Chapter 2 Using the Analyzer provides an outline of the most common analyzer functions users who want a quick introduction to the analyzer and its main functions User s Guide Chapter 3 Using the Online Help describes the types of online help availa...

Страница 9: ...uctions for using the analyzer all users QuickReference provides a brief overview of the analyzer s main features and functions all users Setting Up the Interface Pod guides a series of guides that provide descriptions of and instructions for installing individual interface pods all users Worldwide Support card provides information about support service and warranty all users Release Notice if rel...

Страница 10: ...y on the CD ROM This directory contains the following files File Manual 5200ug31 pdf Broadband Network Analyzer User s Guide 5120ig1a pdf Setting up the DS1DS3 Interface Pod 5121ig1a pdf Setting up the E3 Interface Pod 5122ig1a pdf Setting up the OC 3 STM 1 Optical Interface Pod 5123ig1a pdf Setting up the STM 1 Electrical Interface Pod 5125ig1 pdf Setting up the E1 Interface Pod 5126ig1 pdf Setti...

Страница 11: ...a Printer to the Analyzer 1 21 To Switch the Analyzer On and Off 1 22 To Back Up and Restore Files 1 23 To Back Up Files 1 24 To Restore Files 1 25 To Reset the Notebook PC 1 27 To Insert or Remove an Interface Pod 1 28 To Troubleshoot the Analyzer 1 30 To Print a Window 1 33 2 Using the Analyzer To Connect to the System Under Test 2 2 Intrusive System Connection 2 3 Non Intrusive System Connectio...

Страница 12: ...o Inject Alarms and Errors 2 48 To Inject Protocol Layer Alarms and Errors 2 48 To Inject Physical Layer Alarms and Errors 2 51 To Use Macros 2 54 To Create a Macro 2 55 To Edit a Macro 2 56 To Play a Macro 2 56 3 Using the Online Help To Install the Online Help 3 2 To Install the Online Help on a PC 3 2 To Install the Online Help on a Workstation 3 3 To Display the Online Help 3 5 4 System Admini...

Страница 13: ...dards and Specifications Standards 5 2 Electrical Specifications 5 3 External Connectors 5 4 Timing and Frequency References 5 10 Foreground Traffic Generation 5 11 Capture and Playback System 5 13 Mechanical and Environmental Specifications 5 14 Appendixes Hexadecimal to ASCII Conversion A 2 Default Acadia Configuration B 2 ...

Страница 14: ...xiv ...

Страница 15: ...n 1 2 To Unpack the Analyzer 1 3 To Connect the Analyzer to a Computer 1 6 To Connect a Printer to the Analyzer 1 21 To Switch the Analyzer On and Off 1 22 To Back Up and Restore Files 1 23 To Insert or Remove an Interface Pod 1 28 To Troubleshoot the Analyzer 1 30 ...

Страница 16: ...When you receive your HP Broadband Service Analyzer you must perform the following steps before you can use it Unpack the analyzer Connect the analyzer to a controlling computer Switch on the analyzer Prepare the analyzer for use Insert the interface pods ...

Страница 17: ... list in each box within the packing carton Caution The external connectors on the analyzer and interface pods are susceptible to electrostatic discharge ESD Handle the equipment with the necessary care to avoid ESD damage during unpacking installation and operation The analyzer can operate either standing up or lying flat Use the stabilizing feet if you want the unit to stand up Stabilizing feet ...

Страница 18: ...oolkit p n E5190A You will also receive a set of diskettes containing the PC based online help and or a CD ROM that contains the analyzer software notebook PC software PC based online help UNIX based online help Caution When you receive your analyzer you should make a complete backup of the notebook PC hard disk This will save you time in the future if you ever have any problems with the notebook ...

Страница 19: ...r Sync Out Output for synchronizing external equipment or for synchronizing the Data Clocks Measurement System or Data Timestamps of another analyzer to this analyzer UTP Connects the analyzer to a 10BaseT Ethertwist TPE Local Area Network When the analyzer is supplied with an Omnibook the UTP port is used for connecting the analyzer to the Omnibook AUI Attachment Unit Interface connector used wit...

Страница 20: ...ice Analyzer and the supplied notebook PC are pre configured for all of these connections except for network specific configuration parameters For a networked system you will need to record additional information See To Connect the Analyzer as a Networked System on page 1 10 The default configuration for the analyzer is as follows The default configuration for the notebook PC is as follows Boot so...

Страница 21: ...ation then archive this data using backup storage media See To Back Up and Restore Files on page 1 23 To Connect the Analyzer as a Standalone System You should connect the analyzer as a standalone system for onsite testing for example at an installation site or a monitoring point There are two ways you can connect the analyzer as a standalone system point to point ethernet interface point to point...

Страница 22: ...ects If there is a boot failure the analyzer attempts to boot from the host computer using the configured boot host and analyzer IP address 2 Connect the network cable E5200 64005 to the PCMCIA LAN cable 5 Connect the analyzer to a mains power outlet 3 Connect the analyzer to the notebook PC using the PCMCIA LAN cable 4 Connect the AC adapter to the notebook PC 1 Connect the cross over cable E5200...

Страница 23: ...e Analyzer On and Off on page 1 22 then use the system administration functions of the analyzer to set the system administrator password see To Change a Password on page 4 6 required users see User Online Help date time and time zone see To Set the System Date Time and Time Zone on page 4 7 printer see User Online Help 1 Connect the analyzer to the notebook PC s serial connector If this cable is n...

Страница 24: ...alyzer 4 Test for network connectivity 5 Install the online help UNIX workstation only 6 Record the system administration information To Configure the Notebook PC or Workstation If you are connecting the analyzer to the notebook PC via your network use Acadia Vxd to reconfigure the following parameters assigned by the system administrator notebook PC hostname notebook PC IP address notebook netmas...

Страница 25: ...s see the User Online Help Notebook PC UNIX Workstation Boot source local disk local disk Analyzer Ethernet IP Address This must match the analyzer s IP address that you recorded in Acadia Vxd This must match the analyzer s IP address you added to the etc hosts file Analyzer Ethernet IP Netmask This must match the notebook PC s ethernet netmask IP address that you recorded in Acadia Vxd This must ...

Страница 26: ... To Connect the Analyzer Note You can also connect the analyzer to a LAN using a Medium Attachment Unit MAU An MAU cable is not provided with the analyzer 2 Connect the analyzer to a mains power outlet 1 Connect the analyzer to the LAN using the UTP cable E5200 64005 ...

Страница 27: ...lyzer to connect to your X display See your system administrator or the UNIX online man pages for more details If you are using the notebook PC click the Ping icon in the Acadia Vxd program group Ping the notebook PC and the analyzer separately using their hostnames To Install the Online Help If you have HP UX superuser permission you can install the analyzer help on an HP series 700 workstation r...

Страница 28: ...o highlight the option then pressing either Enter or F4 The Select All Filesets on the Source Media window is displayed 8 Select Start Loading Now by using the arrow keys to highlight the option then pressing either Enter or F4 A message window is displayed asking you whether you want to Start loading filesets now 9 Type y The Loading Partitions and Filesets window is displayed This window indicat...

Страница 29: ...In to the Analyzer on page 2 11 3 After you have connected the analyzer use the system administration functions of the analyzer to set the system administrator password see To Change a Password on page 4 6 required users see User Online Help date time and time zone see To Set the System Date Time and Time Zone on page 4 7 printer see User Online Help remote hosts see User Online Help routing detai...

Страница 30: ...plete the following steps 1 If you are using the PCMCIA internal modem change the COM port assignments for the notebook PC 2 Connect the analyzer 3 Set the remote modem to auto answer 4 Set up the modem connection 5 Record the system administration information To Change the COM Port Assignment 1 From the Main program group click the Control Panel icon 2 Click the OmniBook icon The OmniBook Configu...

Страница 31: ... s user s guide Note You can either connect the notebook PC s serial port to an external modem or you can connect the PCMCIA internal modem directly to the telephone socket 2 Connect the analyzer to a mains power outlet 1 Connect the analyzer s serial port to the modem RS 232C US Euro modem cable p n 24542M part not supplied 3 Connect the notebook PC s serial port to the modem RS 232C US Euro mode...

Страница 32: ...e analyzer SLIP baud rate must match this baud rate 4 If required change the remote phone number To change the remote phone number select e5200a from the Phonebook on the Ipswitch Inc SLIP PPP Configure Dial window click the Setup button then type the new phone number in the Phone field To Record the System Administration Information 1 Switch on the analyzer see To Switch the Analyzer On and Off o...

Страница 33: ... and Time Zone on page 4 7 printer see User Online Help remote hosts see User Online Help routing details see User Online Help remote file systems see User Online Help Note You must have the appropriate privileges to perform system administration functions Note After you have logged out you must disconnect the modem To disconnect the modem 1 Double click the Dialer icon in the Acadia VxD program g...

Страница 34: ...Double click the HP Analyzer Terminal over SLIP icon in the HP Broadband Analyzer program group 2 Switch on the analyzer and hold down the Enter key on the terminal for five seconds until the HP Broadband Service Analyzer Configuration menu appears You must press the Enter key immediately after turning on the power switch The keyboard on the remote workstation must be configured to auto repeat 3 T...

Страница 35: ...lyzer if a printer is connected to your computer The printer must be compatible with PCL 5 If the analyzer is connected to a network you can also print using a LAN printer using PCL 5 Refer to the computer s user s guide for information on how to connect the printer See the system administration functions in the User Online Help to set the current printer ...

Страница 36: ...ED remains green and the Access LED flashes orange intermittently If the Power LED stays red contact your HP support representative To switch off the analyzer switch off the power to the computer and the analyzer When you switch off the analyzer performs a shutdown under software control which makes sure all files are properly closed When you switch off the analyzer the Power LED flashes green dur...

Страница 37: ...eference for more detailed information about how to NFS mount a file system When you first start the notebook PC you should create a bootable diskette in case there is a complete hard disk crash see To Create a Bootable Diskette on page 1 23 You should also backup the notebook PC hard disk see To Back Up Files on page 1 24 To Create a Bootable Diskette 1 Place a formatted diskette in drive A 2 At ...

Страница 38: ...hin the HP Broadband Analyzer program group 3 Set the Network Path to E5200A IDE 4 Set the Drive to G or any unused drive designator 5 Click the Connect button The current drive connection information should now display E5200A IDE on G 6 Click the Close button to close NFS Client 7 Open the Windows File Manager 8 Back up drive G to drive C by dragging and dropping the G usr directory to the C dire...

Страница 39: ...maged or lost from the analyzer s hard disk you should restore the latest version of the files that you have backed up To Restore Files from Backup Storage Media to a Notebook PC If the notebook PC boots restore the files using the Microsoft Restore Utility in the Microsoft Utilities program group See the Microsoft Windows Ver 3 1 User s Guide If the Notebook PC Does Not Boot 1 Press F2 then F8 2 ...

Страница 40: ...gram 10 Follow the instructions on the screen to restore files from the backup storage media To Restore Files from a Notebook PC to the Analyzer 1 Open the HP Broadband Analyzer program group within the Windows Program Manager 2 Open the NFS Client icon within the HP Broadband Analyzer program group 3 Set the Network Path to E5200A IDE 4 Set the Drive to G or any unused drive designator 5 Click th...

Страница 41: ...mount point To Reset the Notebook PC To reset the notebook PC to the default configuration 1 Exit Windows 2 At the DOS prompt type cd resetpc then press Enter 3 At the c resetpc prompt type resetpc then press Enter This utility resets the analyzer and the Windows configuration to the default values If the notebook PC had non analyzer related software loaded on it the relevant program groups will n...

Страница 42: ...are susceptible to ESD The analyzer uses high speed digital interfaces which are susceptible to ESD ESD may cause received data to be corrupted To Insert an Interface Pod into the Analyzer 1 Hold the interface pod with the front panel connectors facing toward you and the Hewlett Packard logo facing upwards 2 Insert the interface pod into Port 1 or Port 2 of the analyzer 3 Push the interface pod fi...

Страница 43: ...ards To Remove an Interface Pod When you remove an interface pod make sure you store it in a dust free location that meets the environmental requirements listed in the Setting Up the Interface Pod guide An electrostatic bag has been supplied for storing each interface pod Note Before you use an optical interface pod you should clean the optical connectors and test cables See the appropriate Settin...

Страница 44: ...tt Packard at your convenience If the Power LED is continuously red there is a serious hardware fault Return the analyzer to Hewlett Packard If the Analyzer Switches on Normally but You Cannot Display the User Interface Check that the LAN cable between the analyzer and the notebook PC or workstation is properly connected Check that the analyzer is correctly configured for the network Check that th...

Страница 45: ...o Restore Files from Backup Storage Media to a Notebook PC on page 1 25 using the reset facility see To Reset the Notebook PC on page 1 27 If You Cannot NFS Mount the Analyzer File System Check that Nfsdw and Inetdw are running on the notebook PC If they are running the icons will be displayed on the screen If You Cannot Print to the Connected Printer Check that the PC Xware LPD is running on the ...

Страница 46: ...is Displayed Contact HP Customer Support Print the window and fax it to HP Customer Support See To Print a Window on page 1 33 Note If you cannot access the analyzer after performing the required checks refer to the Worldwide Support card for information on how to obtain customer support ...

Страница 47: ... captured window will print on your default printer To Print a Window from an HP UX Workstation 1 Make sure the window you want to print does not have any other window in front of it 2 In a shell window type xwd out file_name You must save and name the captured window file in order to print it The cursor turns into a cross hair 3 Move the cursor over the window you want to save then click the left...

Страница 48: ...Setting Up the Analyzer To Troubleshoot the Analyzer 1 34 ...

Страница 49: ...e Analyzer 2 16 To Configure the Analyzer and Ports 2 18 To Monitor the Link Network 2 20 To Monitor a Channel VPI VCI 2 26 To Monitor Alarms and Errors 2 28 To Log Statistics 2 33 To Run SMARTtests and Predefined Macros 2 36 To Capture and View Data 2 38 To Simulate Traffic 2 44 To Inject Alarms and Errors 2 48 To Use Macros 2 54 ...

Страница 50: ...ich may be a blank pod 2 Connect the interface pod s to the SUT Each interface pod has a transmit and receive connector on its front panel that you use to connect to the SUT See the Setting Up the Interface Pod guides for specific details relating to your interface pods Note If you are using an optical interface pod ensure that the connectors on the front panel and the test cables are clean Refer ...

Страница 51: ...stem are network element remote loopback in line The interface configuration options for an intrusive connection are full duplex receive loopback regenerator loop through Network Element Test Connection You can use the analyzer to transmit test traffic that passes through the network element then returns to the analyzer for analysis and comparison with the originally transmitted test traffic A typ...

Страница 52: ...plex for the network element connection If you use the receive loopback configuration or the recovered clock timing source make sure the network element transmitter is synchronized to an independent timing reference to avoid problems that may be caused by possible clock failure Remote Loopback Test Connection The remote loopback test connection is an out of service test that is the network is not ...

Страница 53: ...nnection to test any new element you add to the network When the element passes all relevant tests you change to the remote loopback test connection and test to see what effect the new element is having on the other network elements in the loop You can also use this test to identify a problem with a system that is offline Configure the affected port s for full duplex for this type of test connecti...

Страница 54: ... better to use a non intrusive system connection such as passive and T piece test connections Non Intrusive System Connection A non intrusive system connection does not affect the traffic on the link to which the analyzer is connected A non intrusive system connection is most useful because you can run in service tests without interfering with the live system traffic There are two test connections...

Страница 55: ...default interface configuration is full duplex T piece Test Connection This is a type of non intrusive test connection that requires a T piece or splitter already present at a cross connect However it does steal some power from the traffic being transmitted over the network so the T piece or splitter should be as close as possible to the transmit source where the power is at its strongest For elec...

Страница 56: ...ction A diagnostic connection does not affect the traffic on the link to which the analyzer is connected Use this connection when you want to test the analyzer There are two diagnostic test connections available for the diagnostic system connection transmit loopback external loopback You can connect any of the interface pods available with the analyzer in a diagnostic system connection T piece Por...

Страница 57: ...e connector For E1 interface pods set for the transmit loopback interface configuration you can select either the BNC or RJ 48 equipment or line connector as the transmitting connector For all other interface pods you can only transmit using the connector labeled Out External Loopback Test Connection Typical applications for this type of connection include calibration self testing troubleshooting ...

Страница 58: ...erfaces of the same line rate and configuration For example you can make an external loopback connection across two ports between two OC 3 STM 1 interfaces Use the external loopback connection to monitor capture and transmit traffic Configure the affected ports for full duplex interface configuration for the external loopback test connections Port 1 Port 2 Port 1 Port 2 ...

Страница 59: ...annot log in to the analyzer reboot the notebook PC by pressing Ctrl Alt Del If you still cannot log in refer to the Worldwide Support card for information about how to obtain customer support To Log In to the Analyzer Graphical User Interface Double click one of the following icons in the HP Broadband Analyzer program group Use this icon to start the HP Broadband Service Analyzer with a PC connec...

Страница 60: ...g the default configuration and displays the analyzer s main screen and Link Monitor If any of the information you entered is incorrect the analyzer displays an error message and prompts you to try again Note The HP Broadband Service Analyzer has two sets of default login information 1 Type your user name You are assigned a user name by your System Administrator 2 Type your password 3 Click OK Use...

Страница 61: ...analyzer hostname 2 Type telnet analyzer hostname 5200 The analyzer hostname is assigned by your system administrator The HP Broadband Service Analyzer Login window displays To Log In to the Command Line Interface Double click one of the following icons Use this icon to start the Command Line Interface to the HP Broadband Service Analyzer see the Macro Online Help The terminal is connected through...

Страница 62: ...re version saf start the System Administration functions reboot reboot the analyzer exit exit the CLI See the Macro Online Help for information about how to use the Command Line Interface To Read the Analyzer s Main Screen The analyzer s main screen is the first screen displayed after you log in Link Monitor is shown for each active port You can view either Link Monitor or the Simulator for each p...

Страница 63: ...uture but do not want to re enter all the session details from the File menu choose Save Session To load a saved system configuration into the analyzer from the File menu select Restore Session Menu Bar Link Monitor See To Monitor the Link Network on page 2 20 and To Monitor a Channel VPI VCI on page 2 26 Help hints See Help Hint Bar on page 3 7 Alarm and Error Indicators See To Monitor Alarms and...

Страница 64: ...om the Analyzer If you are logging alarms and errors when you log out the analyzer displays a message reminding you that you are still logging When you exit the analyzer logging stops 1 From the File menu select Exit 2 Click Yes or 1 Double click the Control menu box ...

Страница 65: ...nect the modem 1 Double click on the Dialer icon in the Acadia VxD program group The Ipswitch Inc SLIP PPP Configure Dial window displays 2 Select e5200a from the Phonebook list 3 Click the Hangup button The connection closes After you have logged out switch off the analyzer See To Switch the Analyzer On and Off on page 1 22 ...

Страница 66: ...agnostic tests Select receive loopback for non intrusive tests Select regenerator for intrusive tests for optical interface pods The default configuration option is full duplex These options are also available from the Simulator To set the measurement system and the reference clock see the User Online Help To Configure a Port The analyzer auto configures each port after you switch on the power and...

Страница 67: ...ort If you want to reset the configuration parameters to the default values after you have changed them click the Auto button Clicking the Reset button on the main screen also resets the port configuration parameters to their default values 2 Click the ATM tab then specify the ATM configuration parameters for the port 3 Click the Signaling tab then specify the signaling configuration parameters fo...

Страница 68: ...any abnormalities Information relating to the interface pod and the link for port 1 is shown on the left side of the screen information relating to the interface pod and link for port 2 is shown on the right side of the screen When one of the ports is empty the analyzer displays a message telling you that there is no interface pod inserted in that port All measurements shown on Link Monitor are cu...

Страница 69: ...nto two main areas Link Summary These graphs show you a summary of the condition of the link You can double click each graph to enlarge it and see detailed information These measurements are current and the values are updated in real time while you view the graph Link summary graphs Channel summary ...

Страница 70: ... Period window The top ten channels might change at the end of an update period You can go to Channel Monitor from the enlarged graph by clicking a bar in the graph to select a channel then clicking the Monitor Channel button AAL Usage Graph The second link summary graph shows what percentage of the traffic is made up of each AAL type This is based on the mean sample bandwidths of all channels in ...

Страница 71: ...u double click the graph to enlarge it the analyzer displays the following information maximum bandwidth available for the port which is the maximum value on the bandwidth axis for the graph maximum sample bandwidth over the past 300 seconds dark blue line mean sample bandwidth over the past 300 seconds light blue line The gap between the maximum and mean sample lines is an indication of how burst...

Страница 72: ...nt measurement period To go to Channel Monitor and see detailed information about a specific channel select a channel by clicking on the row for that channel then click the Monitor Channel button The analyzer can monitor up to 1024 channels at a time Any channels over the 1024 limit are not shown in the channel summary You can select a specific channel on Channel Monitor that will display on the c...

Страница 73: ... To select a specific channel 1 Start Channel Monitor 2 Click the Set Up button 3 Type the VPI and VCI to set up a new channel 4 Select either automatic decode or manual decode to set the PRBS pattern or AAL type 5 Click OK See also To Monitor a Channel VPI VCI on page 2 26 ...

Страница 74: ...on other higher layers It also provides graphs that show the way the channel is working which help to highlight any abnormalities All measurements shown on Channel Monitor are current The analyzer updates the measurements at the end of the update period as set on the Set Measurement Period window Start the Channel Monitor in one of the following ways Select one of the channels shown in the channel...

Страница 75: ...ith more than one MID Channel Monitor AAL measurements are available only after you select a specific MID You can select a MID in the Channel Monitor window only if you select to decode the channel manually as AAL 3 4 in the Set Up Channel window The maximum sample bandwidth during the past 300 seconds Select the VPI VCI and MID for AAL 3 4 of the channel you want to view Alarms and errors that oc...

Страница 76: ...l alarms and errors to find out what the relationships between the different alarms or errors mean This tells you the probable cause for an alarm or error which can help you resolve network problems To Monitor Alarms and Errors on the Link A row of indicators at the top of Link Monitor warns you when alarms and errors occur within the link at the physical ATM AAL and OAM levels The color of the in...

Страница 77: ...sing an optical interface pod run an external loopback test on the port to determine whether there is a problem with the network or with the test cables or connectors If the problem is not in the network clean the optical connectors and cable connectors See the appropriate Setting Up the Interface Pod guide for instructions 1 Click an alarm and error status indicator to display the summary window ...

Страница 78: ...es of alarms and the number of one second intervals that contain each alarm count and bandwidth of ATM cells a summary of errors displayed as seconds count or ratio ATM Adaptation Layer AAL affected channel VPI VCI for each AAL type Sequence Number and Cell Loss errors for AAL 1 CRC errors for AAL 3 4 and AAL 5 number of affected channels OAM affected channel or path flow type segment or end to en...

Страница 79: ...hows details of the alarms and errors that occurred at each layer Click a tab for more information about ATM and AAL alarms and errors Note If the analyzer receives a large number of errors for a channel it detects that channel s AAL type as Null If you want to monitor AAL statistics for that channel you need to set up the channel and set the AAL type manually Ensure you select the Summary tab Use...

Страница 80: ... and errors occurred to see whether the bandwidth was affected On the protocol specific Channel Monitor look for alarms of similar duration errors with similar counts See also User Online Help Note All alarms and errors that occur at the physical layer affect the ATM layer and might render all ATM statistics invalid Click a protocol tab to view detailed information about the alarms errors and othe...

Страница 81: ... define are logged to the specified file Logging continues until you click the Stop button 2 If required append the new statistics to the end of an existing log file 3 Specify whether you want to log predefined statistics user defined statistics or both 1 Specify the file to which you want to log statistics 4 Turn logging on off ...

Страница 82: ...Print button to send the contents of the log file to the default printer You cannot print the log file while you are still logging statistics 2 Select the layer for which you want to display the statistics 1 Select the port for which you want to display the statistics 3 Click one or more of the available variants 4 Click Select ...

Страница 83: ...text You can view log files up to 32 000 bytes in size using the macro editor 1 Click the Stop button in the Log window to stop logging statistics 2 From the Macro menu select Edit to display the macro editor 3 Specify the name of the log file you want to view The analyzer displays the named log file in the editor window ...

Страница 84: ... the rest If you are not sure which SMARTtest to run see the User Online Help Help is available for all SMARTtests describing what each one does who should run it and why and when to run it Make sure the analyzer is connected to the system under test and the port is configured for full duplex mode Refer to To Connect to the System Under Test on page 2 2 1 Select the transmit and receive connection...

Страница 85: ...Stop button When the SMARTtest completes the figure jumps up if the SMARTtest passes or falls down if it fails The SMARTtest Results window also appears indicating whether the SMARTtest passed or failed and if relevant why it failed The analyzer automatically captures data for each SMARTtest If the SMARTtest fails you might find this captured information useful for diagnostic purposes Predefined M...

Страница 86: ...igger and post trigger data to determine the possible causes of a fault produce reports from captured logged and monitored data look for patterns in protocols not currently supported by the analyzer store data for offline analysis at another time The analyzer s data capture options let you choose the source of the data to capture for example data for a specific channel or set of channels the IP ad...

Страница 87: ...d port then select the Capture option From Link Monitor click a channel in the channel summary then click the Capture button From Channel Monitor click the Capture button From the AAL error or OAM alarm summary click the Capture button From the Simulator click the Capture icon To display the View Captured Data window for a multiport capture from the Monitor menu select Multiport then select the Ca...

Страница 88: ...u want to capture cells or AAL 5 frames 2 Select the type of data you want to capture Click the Patterns button if you want to define a capture pattern 3 If required select the events to start and stop the capture Click the Triggers button if you want to select interface pod capture events to trigger the capture 4 If required select to capture cells that match a specific pattern only 5 Start the c...

Страница 89: ... data files in the following directory USR E5200A HOME USERNAME PDU You can also use this window to load and view previously captured data Use the Hexadecimal to ASCII conversion table when analyzing PDUs and byte values See Hexadecimal to ASCII Conversion on page A 2 Stop capturing data Continue capturing data after you have stopped a capture Start capturing data Indicates the capture memory capa...

Страница 90: ...n or out file path is not specified the default directory HOME broadband recordings is used If you only type cap2bsts information about converting data is displayed This information provides details of the conversion utility such as version number As the conversion progresses messages are displayed indicating the number of cells that have been converted When all of the cells have been converted a ...

Страница 91: ...Using the Analyzer 4 Click the converted data file in the list then click OK The captured data file is displayed on the BSTS Playback Recording window Note When you convert data captured by the analyzer to BSTS you will lose the dates in the timestamps ...

Страница 92: ...r transmitting the traffic you can monitor its effect using Link Monitor and Channel Monitor Display the Simulator by clicking the Simulate tab for the required port from the main screen Note When the port from which you re transmitting is configured in full duplex mode with a recovered clock clock errors may occur if the receiver signal is poor To avoid errors change the clock to internal or moni...

Страница 93: ...y to transmit captured data that is currently in the capture memory At the top of both Simulate Traffic windows are On Off buttons to turn traffic transmission on and off Display the View Captured Data window to capture data See To View Captured Data on page 2 41 Display Channel Monitor See To Monitor a Channel VPI VCI on page 2 26 Turn the laser on or off for optical interface pods Display the Ph...

Страница 94: ...s Click the Transmit button to transmit a single cell 3 Edit the encode options for each channel if required 1 Select the channels on which you want to transmit data Channel 0 is the foreground channel and channels 1 10 are background channels 2 Enter the VPI VCI for each channel 5 Select to transmit data continuously or as single cells for the foreground channel 4 Set the traffic profile and band...

Страница 95: ...ile you want to use The currently selected profile is shown on the button View the contents of the capture memory or capture new data from the link 1 Select to transmit continuously or as single cells If you select single cells click the Transmit button to transmit Click this button to change the profile distribution and bandwidth ...

Страница 96: ...rs OAM alarms cell losses Display the Protocol Alarms Errors window in either of the following ways From the Simulate menu select the required port then select Protocol Alarms Errors Click the Simulate tab for the required port to display the Simulator then click the Protocol Alarms Errors button Note For optical interface pods the laser is automatically switched off when you log in to the analyze...

Страница 97: ...g the Analyzer To Inject OAM Alarms 1 Click the OAM Alarms tab 2 Enter details about the type of alarm you want to simulate either F4 or F5 3 Click the On button to start injecting OAM cells or click the Inject button to inject a specified number of OAM cells ...

Страница 98: ...or transmit loopback mode you can also monitor the errors and alarms by watching the Alarm and Error indicators at the top of the main screen 5 Click the bits you want to error 6 Click the On button to start injecting errors or click the Error On For or the Error Off For button to transmit errors for a specified number of cells 4 If required select the part of the cell to error 3 Select the type o...

Страница 99: ...s window in either of the following ways From the Simulate menu select the required port then select Physical Alarms Errors Click the Simulate tab for the required port to display the Simulator then click the Physical Alarms Errors button To Inject Physical Alarms The number of alarms you can select at one time depends on the interface pod installed 1 Click the Alarms tab 2 Click the On button for...

Страница 100: ...the top of the Physical Alarms Errors window If you are using an external loopback or transmit loopback mode you can also monitor the errors and alarms by watching the Alarm and Error indicators at the top of the main screen 1 Click the Errors tab 3 Click the Inject button each time you want to inject a single error 3 Enter the rate at which you want to inject errors then click the On button to st...

Страница 101: ...ng the Analyzer To Inject Frameword Errors You simulate frameword errors to stress the framing mechanisms of network elements and ensure that they react correctly to the errors 1 Click the Frameword tab 2 Click the bits you want to error 3 Click the On button ...

Страница 102: ...s such as running a series of tests The analyzer also provides a number of predefined macros that you can run to perform common tasks The macros you create can be used by others For example you can create a macro that contains a complete network test plan then distribute the macro to technicians to ensure that they all use the same test plan The Broadband Service Analyzer macro environment include...

Страница 103: ...e actions that you want to record Click the Pause button to pause the recording Any actions you make while the macro is paused are not recorded Click the Record button to continue recording the macro 1 Type a name for your macro file then click OK Click the Open File button to display the Select File window Click the Save Session button if you want to save your session ...

Страница 104: ...o menu select Play to display the Select File window If you have recorded edited or played a macro since the last time you logged in to the analyzer the Play Macro window appears with the last macro you accessed as the active macro In this case click the File Open icon to display the Select File window 2 Type the name of the macro file that you want to play or select the file from the list 3 On th...

Страница 105: ...3 Using the Online Help Using the Online Help To Install the Online Help 3 2 To Display the Online Help 3 5 3 ...

Страница 106: ...the analyzer online help on any PC with Windows 3 1 or higher 1 Insert the Help for Windows diskette 1 p n E5200 10017 in drive A If you have a CD ROM drive attached to the notebook PC use the supplied CD ROM 2 From the File menu select Run 3 Type a setup to install the help files from the diskettes Type d help win setup to install the help files from the CD ROM 4 Click OK Follow the instructions ...

Страница 107: ...pdate utility by typing etc update The update utility Main Menu is displayed 3 Select Change Source or Destination by using the arrow keys to highlight the option then pressing either Enter or F4 The Change Source or Destination window is displayed 4 Select From Tape Device to Local System as the Update from Source to Destination by using the arrow keys to highlight the option then pressing either...

Страница 108: ... displayed This window indicates the progress of the installation The help package is installed in the OPT E5200A directory 10 When the installation is complete you should view the log file to check for errors in the installation At the prompt type more tmp update log 11 Errors are displayed at the end of the file If there are errors correct the problem type rmfn in a terminal window then reinstal...

Страница 109: ...oadband Series Test System UPE programs for use with the HP Broadband Service Analyzer To display instructions on how to use the help system select Using Help from the Help menu on the main screen You can access help in a number of ways depending on the type of help you require To Display Help Topics Topics within help are organized into help folders The Help Contents list displays a menu of all h...

Страница 110: ... get the version of the help that matches your analyzer To Display Context Sensitive Help Context sensitive help describes the currently selected screen window field icon or button You can display context sensitive help in the following ways Click the Help button that appears on many screens and windows to get information about that screen or window Press F1 If the cursor is on an entry field you ...

Страница 111: ...e Help Help Hint Bar The help hint bar at the bottom of the main screen displays a brief description of the field icon button or menu option over which the cursor is currently positioned Help hint information is available for both entry and non entry fields Help hint bar ...

Страница 112: ...Using the Online Help To Display the Online Help 3 8 ...

Страница 113: ... System Administration 4 System Administration To Use the System Administration Functions 4 2 To Change a Password 4 6 To Set the System Date Time and Time Zone 4 7 To Upgrade the Analyzer Software 4 10 ...

Страница 114: ...ote file systems manage printer information manage user details manage host details These functions are however usually restricted to the system administrator By default the user name boomer and password broadband has full access to all of the system administration functions You can use the manage user details option in the system administration functions to restrict the access privileges for any ...

Страница 115: ...icon in the HP Broadband Service Analyzer program group remotely log in through a Telnet session see the User Online Help use the analyzer Graphical User Interface To Start the System Administration Functions Using the Graphical User Interface See the User Online Help for more information about logging into the system administration functions 1 Type saf 2 Click Send ...

Страница 116: ... Enter All screens have an Exit option 0 on menus or on screens This option takes you to the System Administration Functions Main Menu or if you are at the main menu it takes you back to the Command Prompt window A Help option is also available on all screens This option gives information about the task you are currently performing All screens except menus display the message Press Enter to confir...

Страница 117: ...d and then press Enter to display the next field You cannot go back to a completed field after you press Enter if you need to change a field you must complete all fields again To Change a Completed Field 1 Type 2 Press Enter to cancel the change and return to the previous menu 3 Start again You must use a keyboard in the system administration functions that is you cannot use a mouse to navigate ...

Страница 118: ...tandard business practices for changing passwords Make sure your password is not easily recognizable such as your name To select the Change Password option from the System Administration Functions Main Menu type 1 then press Enter to display the Change Password screen 1 Type your current password then press Enter 2 Type your new password then press Enter 3 Type your new password again then press E...

Страница 119: ...e zone to that of your location If you move the analyzer to a different time zone reset only the time zone The analyzer automatically resets the time and date You should however check that the time and date have been set correctly To select the Set Date and Time option from the System Administration Functions Main Menu type 2 then press Enter to display the Set Date and Time Menu Use this menu to ...

Страница 120: ...nd Time If you need to change the system time and date type 1 on the Change Current Date and Time screen then press Enter to go to the Change Current Date and Time screen 1 Type the date in the format dd mm yy then press Enter 3 Press Enter 2 Type the time in the format hh mm ss then press Enter ...

Страница 121: ...an create a new time zone by typing a numerical offset from the standard time zone in the Please enter the new time zone select option 1 431 or create a new time zone field Enter the offset in the form std hh mm ss You can also specify the daylight saving time See the User Online Help for more information about creating a time zone 2 Type the number corresponding to the location for which you want...

Страница 122: ... floppy diskettes or a CD ROM Before you upgrade the analyzer software you should back up all of the files on the analyzer hard disk See To Back Up and Restore Files on page 1 23 After you have upgraded the analyzer software you should upgrade the analyzer online help see To Install the Online Help on page 3 2 To select the Upgrade Software option from the System Administration Functions Main Menu...

Страница 123: ...cannot even access the previous version of the software restore the latest version of the software from a backup See To Restore Files on page 1 25 Switch off the analyzer power for five seconds see To Switch the Analyzer On and Off on page 1 22 Caution The upgrade does not take place until after you reboot the analyzer Log in to the analyzer see To Log In to the Analyzer on page 2 11 then back up ...

Страница 124: ...ears If the upgrade does not work the message Upgrade failed appears If you cannot reboot the system that is you cannot even access the previous version of the software restore the latest version of the software from a backup See To Restore Files on page 1 25 Switch off the analyzer power for five seconds see To Switch the Analyzer On and Off on page 1 22 Caution The upgrade does not take place un...

Страница 125: ...the analyzer see To Log In to the Analyzer on page 2 11 then back up the analyzer to the notebook PC to the c usr directory see To Back Up Files from the Analyzer to a Notebook PC on page 1 24 or to an HP UX workstation see To Back Up Files from the Analyzer to an HP UX Workstation on page 1 25 ...

Страница 126: ...System Administration To Upgrade the Analyzer Software 4 14 ...

Страница 127: ...2 Electrical Specifications 5 3 External Connectors 5 4 Timing and Frequency References 5 10 Foreground Traffic Generation 5 11 Traffic Loading 5 11 Error Generation 5 12 Measurement System 5 12 Capture and Playback System 5 13 Mechanical and Environmental Specifications 5 14 ...

Страница 128: ...ce between Data Terminal Equipment and Data Circuit Terminating Equipment Employing Serial Binary Data Interchange Bellcore TA TSY 000378 Timing Signal Generator TSG Requirements and Objectives ITU T I 356 B ISDN ATM Layer Cell Transfer Performance ITU T I 361 B ISDN ATM Layer Specification ITU T I 363 B ISDN ATM Adaptation Layer AAL Specification ITU T I 371 Traffic Control and Congestion Control...

Страница 129: ...rds and Specifications Electrical Specifications Power Requirements Mains Parameter Nominal Minimum Maximum Notes Power 450 VA AC Voltage low range 100 120 V 15 10 auto voltage selection AC Voltage high range 200 240 V 15 10 auto voltage selection Frequency 47 Hz 63 Hz ...

Страница 130: ...and Specifications External Connectors 5 4 External Connectors RS 232 Serial Port Conforms to ANSI EIA TIA 232 E 1991 Pin Number Function 1 DCD 2 RXD 3 TXD 4 DTR 5 Ground 6 DSR 7 RTS 8 CTS 9 R1 9 8 7 6 5 4 3 2 1 ...

Страница 131: ...cations External Connectors 5 Standards and Specifications Ethertwist LAN RJ 45 UTP Connector Conforms to ANSI IEEE 802 3 1993 Pin Number Function 1 TD 2 TD 3 RD 4 Not used 5 Not used 6 RD 7 Not used 8 Not used 1 2 3 4 5 6 7 8 ...

Страница 132: ...ameter Nominal Minimum Maximum DC output voltage rating 12 V 11 7 V 12 6 V DC output current rating 0 5 A Pin Number Function 1 Ground 2 Control in 3 Data out 4 Ground 5 Data in 6 Ground 7 Not used 8 Ground 9 Control in 10 Data out 11 Ground 12 Data in 13 12Vout 14 Ground 15 Not used 8 7 6 5 4 3 2 1 9 13 14 15 10 11 12 ...

Страница 133: ...25 ppm conforms to ITU G 703 8 64 kHz composite clock 64 kHz 25 ppm 25 ppm conforms to Bellcore TA TSY 000378 Transmit clock 1 544 MHz 25 ppm 25 ppm all 1 s signal stream when locked to reference Transmit clock 1 544 MHz 150 ppm 150 ppm out of lock condition Maximum voltage any pin relative to pin 7 50 V Pin Number Function 1 Receive A 2 Receive B 3 No connection 4 Transmit A 5 Transmit B 6 No con...

Страница 134: ...put duty cycle 45 55 Input voltage Logic O 0 V 1 5 V Input voltage Logic 1 3 5 V 5 V Input current Logic O 2 mA Vin 0 5 V Pin Number Signal Type Function 1 CMOS input Reserved 2 RS232 Output Reserved 3 RS232 Input Reserved 4 CMOS input 1 MHz clock input 5 CMOS input Reserved 6 Ground Ground 7 Ground Ground 8 Ground Ground 9 Ground Ground 9 8 7 6 5 4 3 2 1 ...

Страница 135: ...ncy 1 MHz 25 Hz 25 Hz Output duty cycle 45 55 Output voltage Logic 0 0 V 0 8 V OH 5 mA Output voltage Logic 1 4 V 5 V OL 5 mA Pin Number Signal Type Function 1 CMOS Output Reserved 2 RS232 Input Reserved 3 RS232 Output Reserved 4 CMOS Output 1 MHz clock output 5 CMOS Output Reserved 6 Ground Ground 7 Ground Ground 8 Ground Ground 9 Ground Ground 6 7 8 9 1 2 3 4 5 ...

Страница 136: ...m 4 6 ppm stratum 3 source External reference frequency 1 MHz 25 Hz 25 Hz Recovered clock frequency fo 25 Hz 25 Hz fo port 1 or 2 interface pod rate BITS T1 reference 1 544 MHz 25 ppm 25 ppm applied to BITS input connector BITS 8 64 kHz composite clock reference 64 kHz 25 ppm 25 ppm applied to BITS input connector E1 reference 2 048 MHz 25 ppm 25 ppm applied to BITS input connector ...

Страница 137: ...ate Sequence length 1 cell 1500 cells Distribution accuracy poisson approximates a poisson distribution for bandwidths of less than 10 maximum Distribution accuracy sawtooth 5 BWmax BWmin 10 Sequence length 500 cells Distribution jitter constant or burst 1 cell 2 cells offset from nominal inter departure time Parameter Nominal Minimum Maximum Notes Frequency range 5 kb s 149 76 Mb s maximum for OC...

Страница 138: ...DUs Number of consecutive errored PDUs Applied to a single VPI VCI or all cells Parameter Nominal Minimum Maximum Notes Measurement duration 3 sec 72 hours 3 days Sample period 100 ms 4 6 ppm 4 6 ppm locked to internal reference Timestamp accuracy 4 6 ppm 4 6 ppm locked to internal reference Timestamp resolution 100 ns Timestamp rollover period 20 days 44 bit timestamp counter ...

Страница 139: ...B Parameter Nominal Minimum Maximum Notes Frequency range 100 b s 149 76 Mb s maximum for OC3 STM 1 optical interface pod Step size 100 b s Accuracy 25 b s relative to line rate Sequence length 1 cell 131072 cells length as captured Distribution accuracy poisson approximates a poisson distribution for bandwidths of less than 10 maximum Distribution accuracy sawtooth 5 BWmax BWmin 10 Sequence lengt...

Страница 140: ...torage temperature of the analyzer with a controlling computer refer to the specifications of the controlling computer Size 335 mm x 440 mm x 100 mm 13 19 in x 17 32 in x 3 93 in Weight 6 kg nominal 13 2 lb Parameter Nominal Minimum Maximum Notes Operating Temperature 5 C 41 F 45 C 113 F with two interface pods installed Storage Temperature 40 C 40 F 70 C 158 F ...

Страница 141: ... Specifications 5 Standards and Specifications Humidity Altitude Analyzer with or without notebook Operating Humidity 15 to 90 relative humidity at 40 C maximum Storage Humidity 90 relative humidity at 65 C maximum Parameter Maximum Operating 4 6 km Storage 4 6 km ...

Страница 142: ...Standards and Specifications Mechanical and Environmental Specifications 5 16 ...

Страница 143: ...A Hexadecimal to ASCII Conversion A Hexadecimal to ASCII Conversion Hexadecimal to ASCII Conversion A 2 ...

Страница 144: ...2C is a comma Hex ASCII Hex ASCII Hex ASCII Hex ASCII 20 space 38 8 50 P 68 h 21 39 9 51 Q 69 i 22 3A 52 R 6A j 23 3B 53 S 6B k 24 3C 54 T 6C l 25 3D 55 U 6D m 26 3E 56 V 6E n 27 3F 57 W 6F o 28 40 58 X 70 p 29 41 A 59 Y 71 q 2A 42 B 5A Z 72 r 2B 43 C 5B 73 s 2C 44 D 5C 74 t 2D 45 E 5D 75 u 2E 46 F 5E 76 v 2F 47 G 5F _ 77 w 30 0 48 H 60 78 x 31 1 49 I 61 a 79 y 32 2 4A J 62 b 7A z 33 3 4B K 63 c 7...

Страница 145: ...B Default Acadia Configuration B Default Acadia Configuration Default Acadia Configuration B 2 ...

Страница 146: ...tion Acadia Vxd has the following default configuration values Host table Domain name information no default configuration IP address 127 0 0 1 localhost 10 0 0 2 e5200apc 10 0 0 1 15200a 10 0 1 1 e5200a_slip 10 0 1 2 e5200apc_slip IP address 10 0 0 2 Netmask 255 255 255 0 Default Router ...

Страница 147: ...ion B Default Acadia Configuration NFS Services TCP IP Services User Authorization no default configuration c usr e5200a c e5200a a e5200a X File Transfer FTP X Finger Printing LPD X Remote Command REXEC X Remote shell RSH X Telnet X Trivial File Transfer TFTP ...

Страница 148: ...ault Acadia Configuration Default Acadia Configuration B 4 Category Environment etc c acadia etc _hostname e5200apc term ibmpc users guest vt100cmap c acadia etc telnet att vt100kmap c acadia etc vtket map ...

Страница 149: ...26 cleaning instructions iv configuration acadia default B 2 configure a port 2 18 configure the analyzer 1 11 2 18 configure the notebook PC or workstation 1 10 connect the analyzer 1 12 connect the analyzer using a modem 1 17 connect to the system unde test instrusive 2 3 connect to the system under test 2 2 diagnostic 2 8 external loopback 2 9 transmit loopback 2 9 intrusive in line 2 5 network...

Страница 150: ...ct 2 53 inject AAL errors 2 50 inject alarms and errors 2 48 frameword errors 2 51 physical 2 51 protocol 2 48 inject ATM errors 2 50 inject OAM alarms 2 49 inject physical alarms 2 51 inject physical errors 2 52 inline test connection 2 5 install online help 3 2 PC 3 2 workstation 1 13 3 3 interface pod insert 1 28 remove 1 29 storage 1 29 IP address default configuration B 2 L Link Monitor 10 Hi...

Страница 151: ...onfiguration parameters 1 20 Network Configuration Facility 1 20 connect a printer to the analyzer 1 21 connect the analyzer as a networked system 1 10 configure the analyzer 1 11 configure the notebook PC or workstation 1 10 connect the analyzer 1 12 install the online help 1 13 record the System Administration Information 1 15 test for network connectivity 1 13 connect the analyzer as a standalo...

Страница 152: ...connection 2 9 transmit loopback test connection 2 9 intrusive 2 3 in line test connection 2 5 network element test connection 2 3 remote loopback test connection 2 4 non intrusive 2 6 passive test connection 2 7 T piece test connection 2 7 T TCP IP default configuration B 3 test for network connectivity 1 13 time zone change 4 9 timing and frequency reference specifications 5 10 T piece test conn...

Отзывы: