D-System Operating Instructions
Hotset GmbH
–
Hueckstraße 16
–
58511 Lüdenscheid, Germany
–
+49 2351 4302 0
–
–
–
04/2021 RS
45
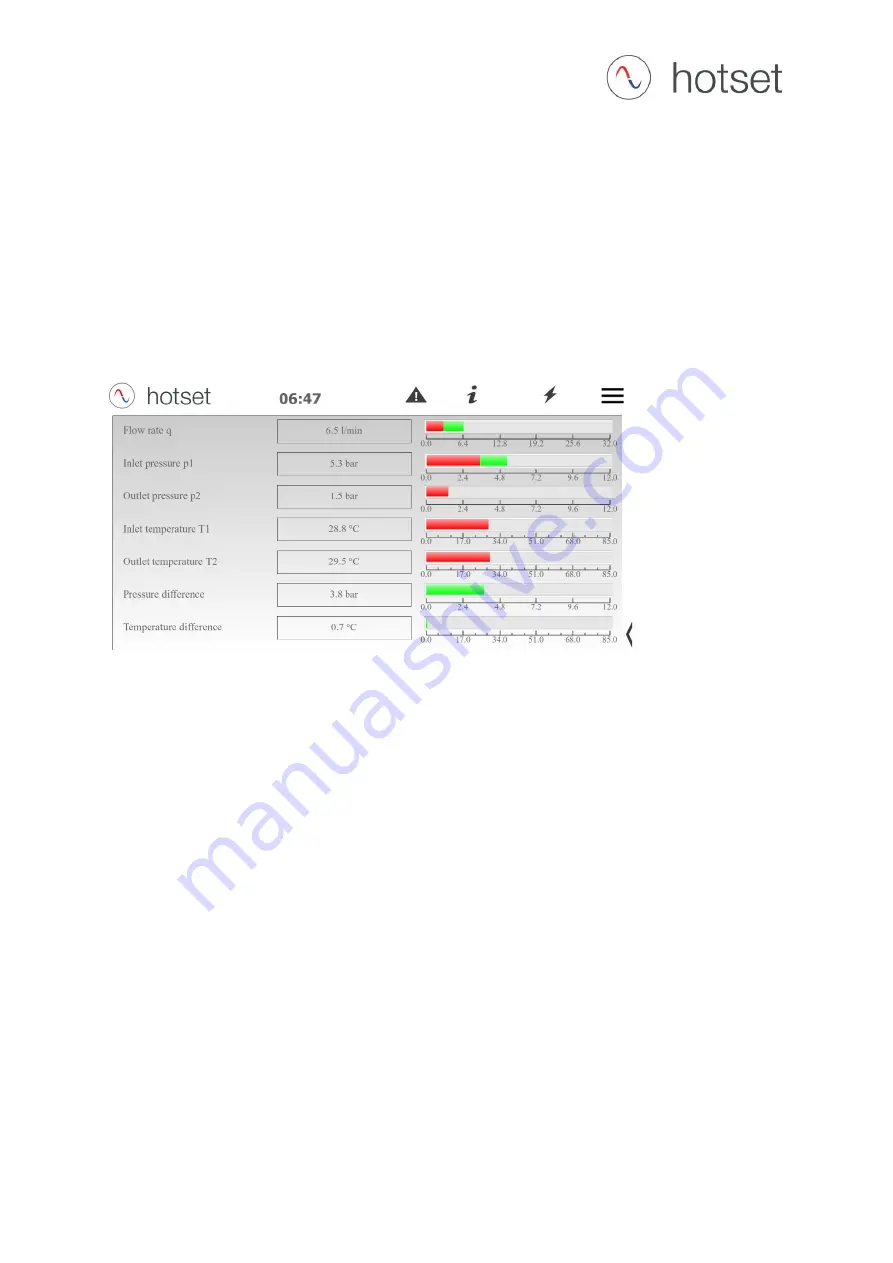
List process overview
In the list view, all measurement data is displayed one below the other, with additional display of
the pressure and temperature difference. In the bar chart to the right, a limit value violation can
be read and is defined in two colors.
The blue area is within the limit values and the red area is outside. This makes it possible to
determine whether a limit value violation is imminent or already present without having to read
off each individual value.


