27
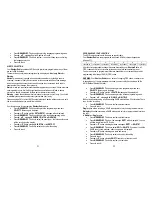
RAIN WINDOW
Displays:
•
Current amount of precipitation as well as for the last hour, last day, yesterday,
last week and last month
•
Rainfall alert
•
Remote rain gauge battery status
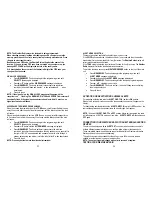
WIND WINDOW
Displays:
•
Wind Chill temperature
•
Temperature at place of anemometer
•
Wind direction
•
Wind speed
•
Wind gust speed
•
Alert for wind speed and wind gust
•
Remote anemometer battery status
28
CUSTOMIZING YOUR WEATHER STATION
It is
required to program:
•
The pressure parameters during Initial Setup (See
Weather and Pressure
Windows
P28)
•
The time, the date and the weekday language (
Time Window
: P32)
•
The location data (
Sunrise/Sunset Window
: P36)
Optional:
•
The time alarms (
Time Window
: P32)
•
The temperature alarms (
Temperature and Humidity Window
P38)
•
Daily rainfall alarms (
Rain Window
P40)
•
Wind alarms (
Wind Window
: P41)
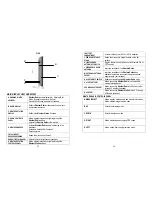
BACKLIGHT
The main unit backlight can be turned on, off or automatically toggled depending on the
light conditions of the environment. Use the light sensor switch at the back of the main
unit to select a desired backlight setting.
For the automatic backlight control, the sensitivity of the light sensor can be adjusted to
high or low using the switch, located on the back panel.
NOTE
: For an automatic control function the main unit must be plugged into the wall
power outlet via the AC/DC adaptor provided.
CONNECTING WEATHER STATION TO A PERSONAL COMPUTER
To collect and manipulate data from your weather station you may connect the main unit
to the computer via USB cable.
Proceed in the following order:
•
Make sure all sensors have batteries installed and the main unit is plugged in
to the wall power outlet through the AC/DC adapter provided
•
Insert the CD-ROM into available drive and install the software following
instructions of the installation wizard.
•
Connect the main unit to the computer USB port using the USB cable provided.
•
Open installed software package: double-click the icon on the computer desktop
You may customize software screen by selecting the weather parameters to be displayed,
units for these weather parameters, location and other user-definable elements.
When determining data transfer interval from the main unit to your computer consider the
time duration for each data point. For example if you select 5 minutes, each point on the
graph will be placed every 5 minutes. If you will select 3 hours, then the graph trend will take
at least 24 hours to show 8 data points.
You can use Print Screen option to create pictures and send them by E-Mail and use them
on your website


