27
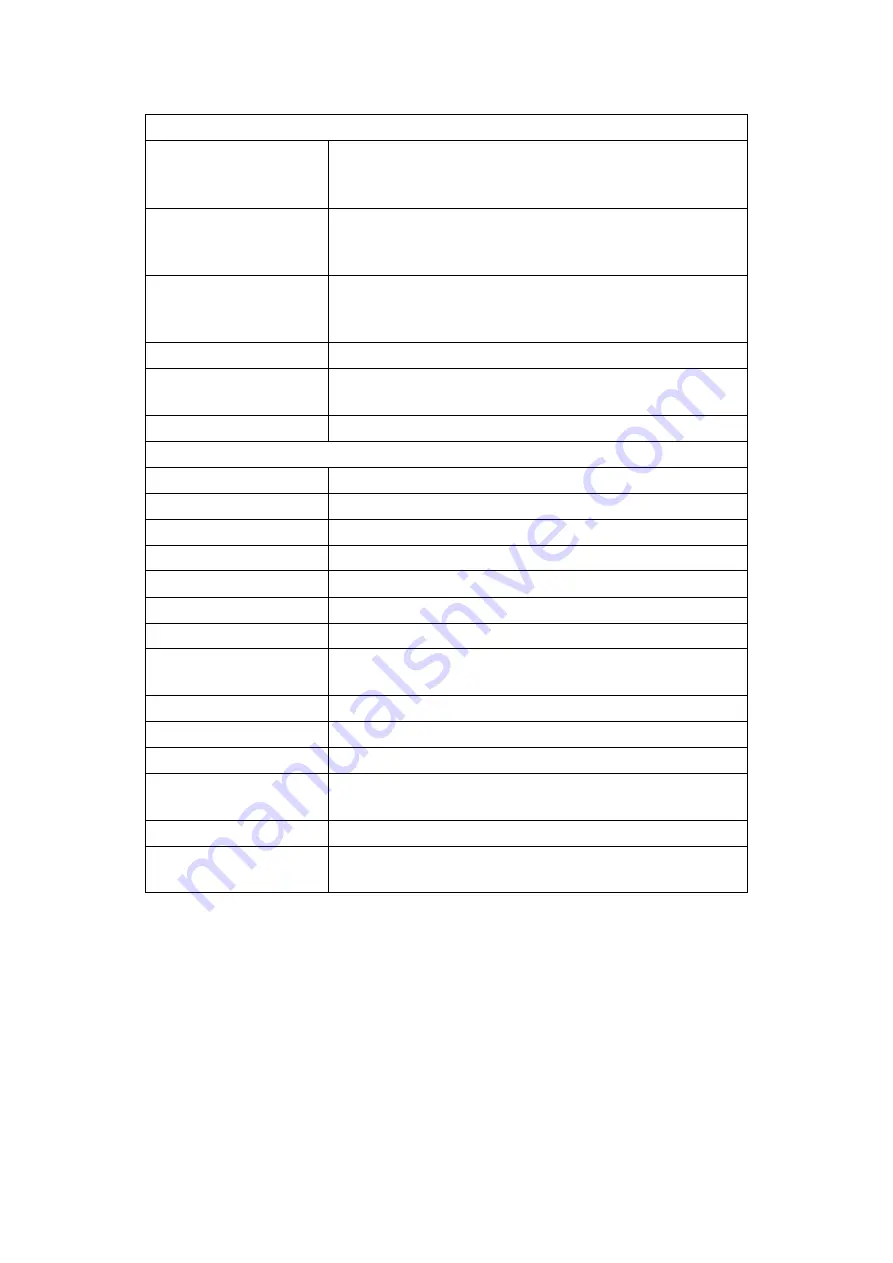
A summary of the options is shown in the table below-
ZOOM OPTIONS
Zoom Time Region
Puts the graph in Zoom X axis mode. Left click the
graph once to specify the start point, and again to
specify the end point.
Zoom Y Axis
Region
Puts the graph in Zoom Y axis mode. Left click the
graph once to specify the start point, and again to
specify the end point.
Zoom Y Axis
Region and Time
Region
Puts the graph in Zoom XY axis mode. Left click
the graph once to specify the start point, and
again to specify the end point.
Zoom Out
Zooms out to the previous zoom level
Zoom Full
Displays the graph full size removing all zoom
levels.
GRAPH OPTIONS
Points
Displays graphs as single data points.
Line
Displays graphs with data points as joined lines.
Filled Line
Same as Line but fills the area under the graph.
3D Line
Same as Line but with a 3D effect.
Bar
Each data point is displayed as a bar.
3D Bar
Same as Bar but with a 3D effect.
Remove Graph
Removes the current graph - indicated as the top
most graph title above the graph
Remove All Graphs
Removes all displayed graphs.
Export Data
Allows an export format to be selected and
exports the data to a file.
Copy Graph To
Clipboard
Puts a copy of the graph on the clipboard so it
may be pasted into other application as an image.
LoLog Vista Display Options
The values shown on the LCD display panel on the Lo Log Vista Data Logger can be
changed to suit the User
’s requirements. The User can do this using the Radwin View
module when connected to the logger.
To change the display format, proceed as follows:
Select
Radwin View
from the start menu.
Содержание LoLog 450 Series
Страница 9: ...8 ...
Страница 35: ...34 MilliAmp Input Circuit Logger mA input ciruit GND B VDD D 4 20mA transmitter ...


