


10
increases.
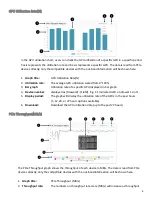
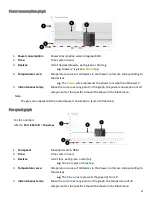
3.
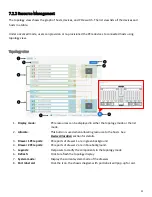
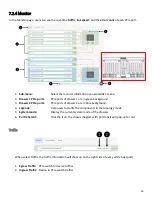
Time:
The X-axis display system times (per hour)
4.
Devices:
List all the devices installed. Every device has a unique color indicator.
5.
Throughput curve:
The curve of PCIe throughput of each device, distinguished by the color.
6.
List down menu:
Displays throughput of each device at a specific time point.
Move the mouse over the curve to see this menu.
7.
Select Traffics:
Select traffic types to display on the throughput graph.
There are three types: Ingress, Egress, and Sum.
8.
Display period:
The graph will display the PCIe throughput rates in the past hours.
(1, 12, 24, 72 hours options available)
9.
Download:
Download the PCIe throughput data (up to past 72 hours)
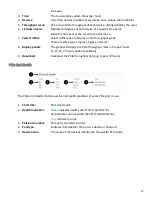
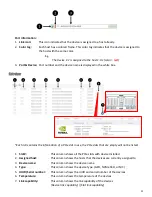
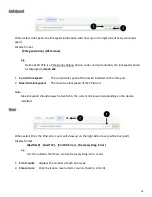
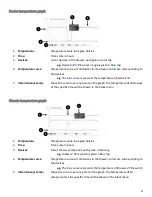
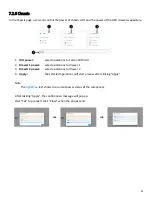
PCIe Link Health
The PCIe Link Health chart shows the link health condition of every PCIe port in use.
1.
Chart title:
PCIe Link Health
2.
Health indication:
Green
indicates healthy (Bad TLP=0, Bad DLP=0)
Red
indicates errors existed (Bad TLP>0, BAD DLP>0)
Gray
indicates no link
3.
PCIe port number:
PCIe ports are listed in order.
4.
Port type:
indicates that whether the port is a device or host port
5.
Device name:
The name of the devices installed on the specific PCIe ports.
Содержание Falcon 4010
Страница 1: ...Falcon 4010 User Manual ...