21
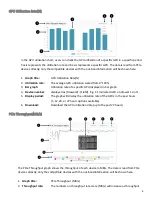
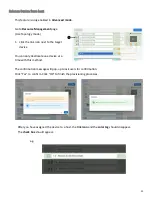
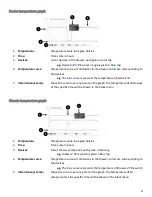
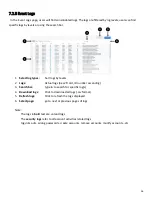
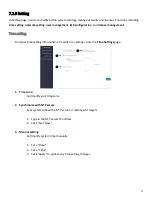
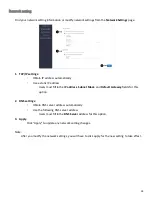
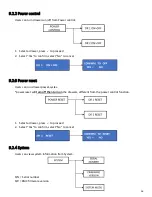
Device temperature graph
1.
Temperature:
Temperature scale in degree Celsius
2.
Time:
Time scale in hours
3.
Devices:
List of devices in the drawer, each given a color tag
e.g.
Device
1:2
in the above image is given a
blue
tag
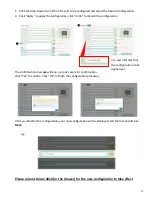
4.
Temperature curve:
Temperature curves of all devices in the drawer, colors are corresponding to
the devices
e.g.
The
blue
curve represents the temperature of device
1:2
5.
Instantaneous temp.:
Move the cursor over any point on the graph, the temperature of all devices
at the specific time will be shown in the black menu
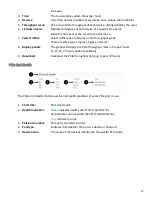
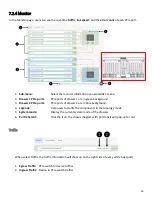
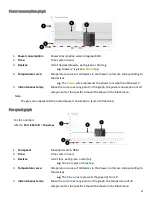
Chassis temperature graph
1.
Temperature:
Temperature scale in degree Celsius
2.
Time:
Time scale in hours
3.
Devices:
List of chassis component, each given a color tag
e.g.
Drawer 2 PCIe switch is given a
blue
tag
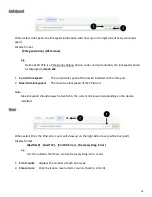
4.
Temperature curve:
Temperature curves of all devices in the drawer, colors are corresponding to
the devices
e.g.
The
blue
curve represents the temperature of Drawer 2 PCIe switch
5.
Instantaneous temp.:
Move the cursor over any point on the graph, the temperature of all
components at the specific time will be shown in the black menu
Содержание Falcon 4010
Страница 1: ...Falcon 4010 User Manual ...

