background image

Pairing Your ANT+ Sensors

Before you can pair, you must put on the heart rate monitor or 

install the sensor.
Pairing is the connecting of ANT+ wireless sensors, for example, 

connecting a heart rate monitor with your Garmin device.

1

Bring the device within 3 m (10 ft.) of the sensor.

NOTE: 

Stay 10 m (33 ft.) away from other riders' ANT+ 

sensors while pairing.

2

Select 

 > 

Settings

 > 

Sensors

 > 

Add Sensor

.

3

Select an option:
• Select a sensor type.
• Select 

Search All

 to search for all nearby sensors.

A list of available sensors appears.

4

Select one or more sensors to pair with your device.

5

Select 

Add

.

When the sensor is paired with your device, the sensor status 

is Connected. You can customize a data field to display 

sensor data.

Training with Power Meters

• Go to 

www.garmin.com/intosports

 for a list of ANT+ sensors 

that are compatible with your device (such as Vector

).

• For more information, see the owner's manual for your power 

meter.

• Adjust your power zones to match your goals and abilities 

(

Setting Your Power Zones

, page 13

).

• Use range alerts to be notified when you reach a specified 

power zone (

Setting Range Alerts

, page 17

).

• Customize the power data fields (

Customizing the Data 

Screens

, page 17

).

Setting Your Power Zones

The values for the zones are default values and may not match 

your personal abilities. You can manually adjust your zones on 

the device or using Garmin Connect. If you know your functional 

threshold power (FTP) value, you can enter it and allow the 

software to calculate your power zones automatically.

1

Select 

 > 

My Stats

 > 

Training Zones

 > 

Power Zones

.

2

Enter your FTP value.

3

Select 

Based On:

.

4

Select an option:
• Select 

watts

 to view and edit the zones in watts.

• Select 

% FTP

 to view and edit the zones as a percentage 

of your functional threshold power.

Calibrating Your Power Meter

Before you can calibrate your power meter, you must install it, 

pair it with your device, and begin actively recording data with it.
For calibration instructions specific to your power meter, see the 

manufacturer's instructions.

1

Select 

 > 

Settings

 > 

Sensors

.

2

Select your power meter.

3

Select 

Calibrate

.

4

Keep your power meter active by pedaling until the message 

appears.

5

Follow the on-screen instructions.

Pedal-Based Power

Vector measures pedal-based power.
Vector measures the force you apply a few hundred times every 

second. Vector also measures your cadence or rotational 

pedaling speed. By measuring the force, the direction of force, 

the rotation of the crank arm, and time, Vector can determine 

power (watts). Because Vector independently measures left and 

right leg power, it reports your left-right power balance.

NOTE: 

The Vector S system does not provide left-right power 

balance.

Cycling Dynamics

Cycling dynamics metrics measure how you apply power 

throughout the pedal stroke, and where you apply power on the 

pedal, allowing you to understand your particular way of riding. 

Understanding how and where you produce power allows you to 

train more efficiently and evaluate your bike fit.

NOTE: 

You must have a dual sensing Edge system to use 

cycling dynamics metrics.
For more information, go to 

www.garmin.com/cyclingdynamics

.

Using Cycling Dynamics

Before you can use cycling dynamics, you must pair the Vector 

power meter with your device (

Pairing Your ANT+ Sensors

page 13

).

NOTE: 

Recording cycling dynamics uses additional device 

memory.

1

Go for a ride.

2

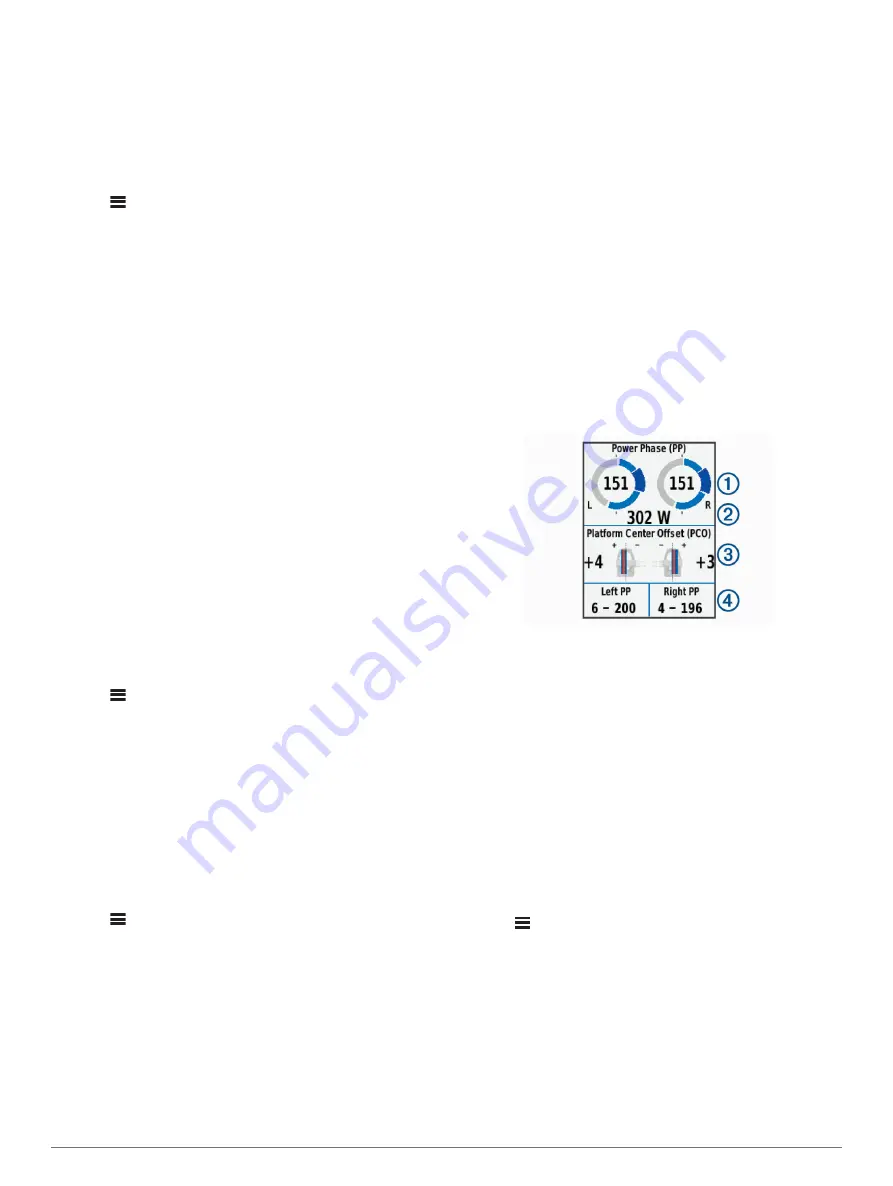
Scroll to the cycling dynamics screen to view your power 

phase data 

À

, total power 

Á

, and platform center offset 

Â

.

3

If necessary, hold a data field 

Ã

 to change it (

Customizing 

the Data Screens

, page 17

).

NOTE: 

The two data fields at the bottom of the screen can be 

customized.

You can send the ride to the Garmin Connect Mobile app to 

view additional cycling dynamics data (

Sending Your Ride to 

Garmin Connect

, page 15

).

Power Phase Data

Power phase is the pedal stroke region (between the start crank 

angle and the end crank angle) where you produce positive 

power.

Platform Center Offset

Platform center offset is the location on the pedal platform where 

you apply force.

Customizing Vector Features

Before you can customize Vector features, you must pair a 

Vector power meter with your device.

1

Select 

 > 

Settings

 > 

Sensors

.

2

Select the Vector power meter.

3

Select 

Sensor Details

 > 

Vector Features

.

4

Select an option.

5

If necessary, select the toggle switches to turn on or off 

torque efficiency, pedal smoothness, and cycling dynamics.

Updating the Vector Software Using the Edge Device

Before you can update the software, you must pair your Edge 

device with your Vector system.

1

Send your ride data to your Garmin Connect account 

(

Sending Your Ride to Garmin Connect

, page 15

).

ANT+ Sensors

13

Содержание Edge 820

Страница 1: ...Edge 820 Owner s Manual...

Страница 2: ...min Android is a trademark of Google Inc Apple and Mac are trademarks of Apple Inc registered in the U S and other countries The Bluetooth word mark and logos are owned by the Bluetooth SIG Inc and an...

Страница 3: ...ls 8 Displaying a Course on the Map 8 Stopping a Course 8 Deleting a Course 8 Course Options 8 Route Settings 8 Selecting an Activity for Route Calculation 8 Map Settings 8 Changing the Map Orientatio...

Страница 4: ...ure 18 Turning the Device Tones On and Off 18 Changing the Device Language 18 Changing the Configuration Settings 18 Time Zones 18 Setting Up Extended Display Mode 19 Exiting Extended Display Mode 19...

Страница 5: ...ice completely About the Battery WARNING This device contains a lithium ion battery See the Important Safety and Product Information guide in the product box for product warnings and other important i...

Страница 6: ...vigate a course Training Select to access your segments workouts and other training options Select to access your history training options personal records contacts and settings Select to access your...

Страница 7: ...your Edge device Follow Strava segments to compare your performance with your past rides friends and pros who have ridden the same segment To sign up for a Strava membership go to the segments widget...

Страница 8: ...ance 5 If necessary enter a custom value for the duration 6 Select Target to choose your goal during the step For example select Heart Rate Zone to maintain a consistent heart rate during the step 7 I...

Страница 9: ...up select to begin the first interval 4 Follow the on screen instructions When you complete all of the intervals a message appears Training Indoors The device includes an indoor activity profile where...

Страница 10: ...s Courses page 7 and segments Segments page 3 Locations and finding places Locations page 6 Planning a course Courses page 7 Route settings Route Settings page 8 Map settings Map Settings page 8 Locat...

Страница 11: ...a nearby point of interest To select a city select Cities and select a nearby city To select an address select Addresses and enter the address To select an intersection select Intersections and enter...

Страница 12: ...on Road Locks the position icon which represents your position on the map onto the nearest road Avoidance Setup Sets the road types to avoid while navigating Recalculation Automatically recalculates t...

Страница 13: ...udio prompt the Garmin Connect mobile app mutes the primary audio of the smartphone to play the announcement You can customize the volume levels on the Garmin Connect Mobile app 1 From the settings in...

Страница 14: ...ect Mobile app 2 Pair your smartphone with your device Pairing Your Smartphone page 9 3 From the app settings in the Garmin Connect Mobile app select Emergency Contacts and enter your rider informatio...

Страница 15: ...e Setting Your Heart Rate Zones page 11 NOTE The estimate may seem inaccurate at first The device requires a few rides to learn about your cycling performance 1 Ride at a steady high intensity for at...

Страница 16: ...icity that interferes with heart rate signals Move away from sources that can interfere with your heart rate monitor Sources of interference may include strong electromagnetic fields some 2 4 GHz wire...

Страница 17: ...ector measures pedal based power Vector measures the force you apply a few hundred times every second Vector also measures your cadence or rotational pedaling speed By measuring the force the directio...

Страница 18: ...data fields Customizing the Data Screens page 17 The Edge device displays current adjustment values when the sensor is in adjustment mode Situational Awareness Your Edge device can be used with the Va...

Страница 19: ...r Plan your training You can choose a fitness goal and load one of the day by day training plans Share your activities You can connect with friends to follow each other s activities or post links to y...

Страница 20: ...pages Widgets Provide information at a glance including sensor data and notifications Apps Add interactive features to your device such as new outdoor and fitness activity types Downloading Connect IQ...

Страница 21: ...ert you when your cadence is below 40 RPM and over 90 RPM You can also use a training zone Training Zones page 6 for the range alert 1 Select Settings Activity Profiles 2 Select a profile 3 Select Ale...

Страница 22: ...llows you to use Bluetooth connected features including LiveTrack and activity uploads to Garmin Connect Call and Text Alerts Allows you to enable phone notifications from your compatible smartphone M...

Страница 23: ...ons protocol The device withstands pressure equivalent to a depth of 30 m For more information go to www garmin com waterrating Speed Sensor and Cadence Sensor Specifications Battery type User replace...

Страница 24: ...ger rides During an activity the screen turns off You can enable automatic alerts and tap the screen to wake it up Battery save mode records GPS track points and sensor data less frequently Speed dist...

Страница 25: ...t The remaining distance to the next point on the course Di2 Battery Level The remaining battery power of a Di2 sensor Di2 Shift Mode The current shift mode of a Di2 sensor Dist Lap The distance trave...

Страница 26: ...current power phase peak angle for the left leg Power phase peak is the angle range over which the rider produces the peak portion of the driving force Power Phase L Peak Avg The average power phase p...

Страница 27: ...y deeper breathing conversation possible Basic cardiovascular training good recovery pace 3 70 80 Moderate pace more difficult to hold conversation Improved aerobic capacity optimal cardiovascular tra...

Страница 28: ...2180 700 40C 2200 700 44C 2235 700 45C 2242 700 47C 2268 Radio Frequency Exposure This device is a mobile transmitter and receiver that uses its antenna to send and receive low levels of radio freque...

Страница 29: ...0 laps 2 lifetime athlete 16 LiveTrack 9 locations 6 deleting 7 editing 7 finding with the map 6 sending 10 locking screen 2 M maps 6 8 finding locations 6 orientation 8 settings 8 updating 21 mountin...

Страница 30: ...support garmin com July 2018 190 02077 00_0B...

Отзывы: