2. GRAPH FUNCTIONS
2-21
2
2.4
Sonde Graph
The [Sonde Graph] plots the water temperature at the net sonde transmitter’s position.
The transmitter which feeds the data is selected at [Net Sensor Temp Graph] in the
[Display] menu. See section 4.3.
To show the [Sonde Graph], click the [Graph] icon (
) from the InstantAccess bar™
to show the [Graph] menu, then click the [Sonde Graph] icon (
). The icon is high-
lighted in green and the graph appears.
The graph is painted in the color set with [Mark Color] in the [Display] menu. The hor-
izontal axis shows temperature, and is linked with the depth scale. The horizontal axis
shows temperature. If the temperature at the net goes out of the range of the current
temperature scale, the scale is automatically changed to accommodate the new tem-
perature.
You can re-locate the graph and change its size by drag and drop.
To close the graph, click the [Close Window] icon ( ).
Note:
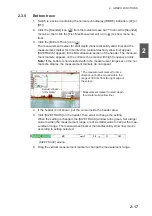
You can clear the [Sonde Graph] and start a new graph at any time. Select the
[Refresh] button (indicated in the figure above) to clear the graph and start a new
graph.
Horizontal axis: temperature
[Refresh] button
Vertical axis: depth
Display
range
Display
range
Содержание FSS-3BB
Страница 12: ...SYSTEM CONFIGURATION x This page is intentionally left blank...
Страница 98: ...4 ADVANCED SETTINGS 4 20 This page is intentionally left blank...
Страница 110: ...5 MAINTENANCE AND TROUBLESHOOTING 5 12 This page is intentionally left blank...
Страница 119: ......
Страница 120: ......
Страница 121: ......


