2. INTERPRETING THE DISPLAYS
2-6
Description of ship’s speed display indications (con’t from previous page)
Item Description
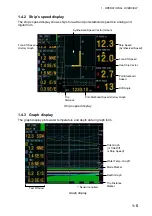
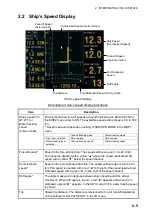
Own ship vector*
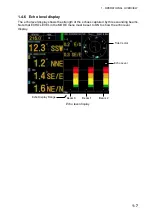
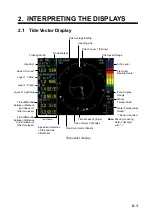
The own ship vector shows port-starboard speed on the x-axis and
fore-aft speed on the y-axis. The “synthesized speed vector”
(green) appears when SCALE SYNC in the DISP2 menu is set to
ON.
Fore-aft speed history graph
This graph shows fore-aft speed history over time, which is useful
in trawling. HISTORY in the DISP2 menu sets the maximum range
for the graph, and you can shift the range with HISTORY SHIFT in
the DISP2 menu. The latest 60 seconds of fore-aft speed is shown,
scrolling from right to left across the screen.
Port-starboard history graph
This graph shows port-starboard speed history over time, which is
useful in trawling. DRIFT HISTORY in the DISP2 menu sets the
maximum range for the graph. The latest 60 seconds of
port-starboard speed is shown, scrolling from top to bottom on the
screen.
*: Speed used for calculation depends on setting of SHIP SPD MODE in the DISP1 menu.
GT/WT: Speed is calculated according to tracking mode, ground speed for ground
tracking mode and water speed for water tracking mode.
WT:
Speed is calculated using water tracking speed regardless of speed tracking
mode in use.
Содержание CI-68
Страница 1: ...DOPPLER SONAR CURRENT INDICATOR CI 68 ...
Страница 10: ......


