CRIRES User Manual
Doc. Number: ESO-254264
Doc. Version: P109.4
Issued on:
2021-12-01
Page:
31 of 99
Document Classification: ESO Internal Use [Confidential for Non-ESO Staff]
Example: let us assume that for a given setting the combination of DIT=2 and NDIT=1 yield
a flux level of 6000 ADU in a specific detector pixel. If NDIT is changed to 4, then the flux
value of the same detector pixel will be still ~6000 ADU, as it is the averaged value of the
four integrations. However, the signal-to-noise ratio (S/N) will be about twice as high than
as for NDIT=1. Note that for each NDIT, the read-out noise listed in
Table
2
applies. This
means that the larger the number of NDIT, the higher the overall read-out noise per
exposure, which will result in a lower signal-to-noise ratio in the observations.
The optimum combination of DIT and NDIT should be determined with help of the Exposure
Time Calculator (ETC, see Section 5.5). Bright objects or observations in the L or M bands
(high thermal background) will require short DITs to stay below saturation due to the thermal
background, as heavily saturated pixel will lead to detector persistence that require a couple
of minutes to decay to the extent that it does not affect subsequent exposures anymore.
Note that the parameter NDIT should not be confused with NEXPO, which is the number of
subsequent exposures (DIT x NDIT). Any exposure will be saved independently (i.e.,
NEXPO=2 will produce two FITS files).
For all detectors, at least 2% of the detector pixels are bad, with detector 3 (right) being the
most affected one.
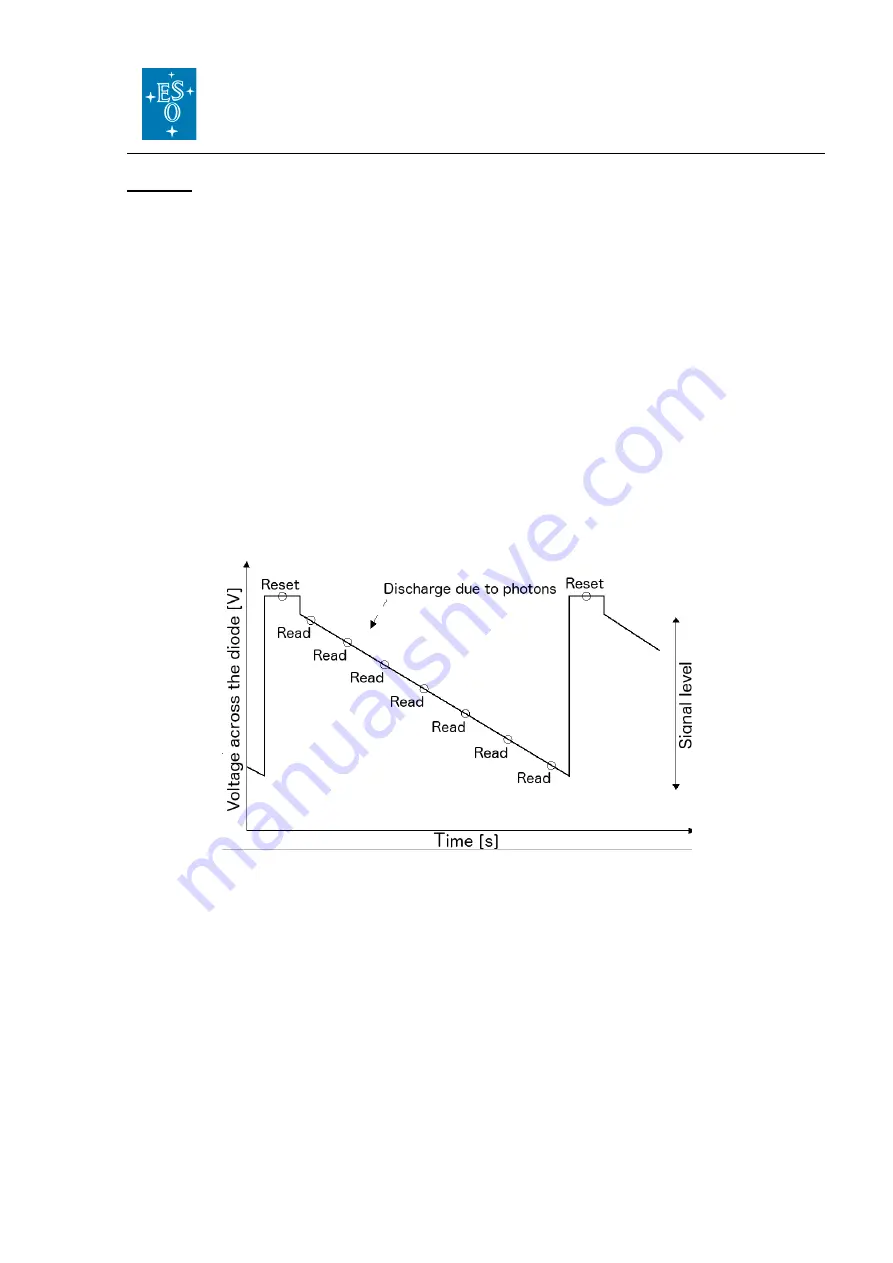
Figure 23: “Sample Up The Ramp” read-out mode. Before each integration, the pixels are
reset to the initial capacity. During the integration, the detector is non-destructively read
(from two readings in case of the minimum DIT up to a maximum of 36 readings for long
DITs). These detector readings are equidistantly spaced in time. The flux rate per pixel
corresponds to the slope of the flux values of the subsequent readings.
4.3.1 Dark current and gain
The dark current is estimated from the slope of the signal (in ADU or e-) as a function of the
integration time (s) for the linear region. Figure 24 shows the dark current of detector #3
measured in K band. The thermal background is of the order of 0.05 e-/px, making the
instrument about 33 times darker than the oCRIRES. A summary of the science detector
characteristics is provided in Table 2.


