Debugger db88 (3)
Development Tools
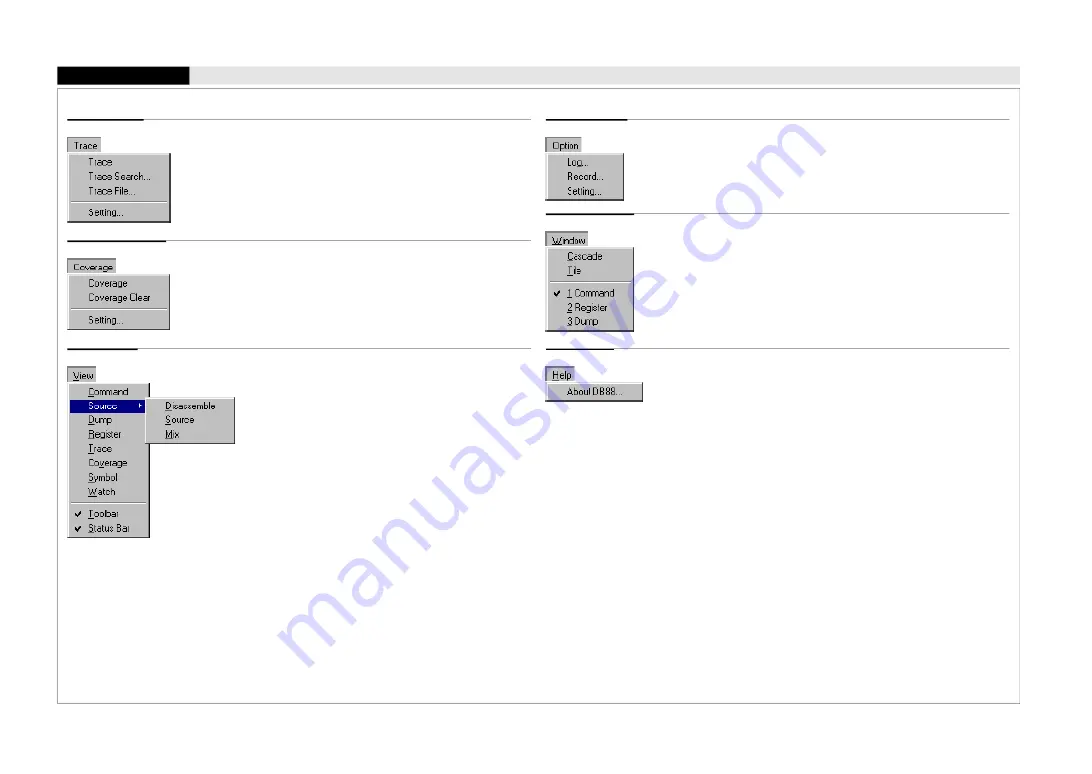
Log...
Starts or stops logging.
Record...
Starts or stops recording of commands executed.
Setting...
Sets system options.
Cascade
Cascades the opened windows.
Tile
Tiles the opened windows.
This menu shows the currently opened window names.
Selecting one activates the window.
About DB88...
Displays an About dialog box for the debugger.
[Window] menu
[Help] menu
Menu
Trace
Displays the trace information.
Trace Search...
Searches trace information from the trace memory.
Trace File...
Saves the specified range of the trace information to a file.
Setting...
Sets a trace mode.
Coverage
Displays the coverage information acquired in the ICE.
Coverage Clear
Clears the coverage information.
Setting...
Selects coverage options.
Command
Activates the [Command] window.
Source (Disassemble, Source, Mix)
[Opens or activates the [Source] window and displays the
program from the current PC address in the display mode
selected from the sub menu items.
Dump
Opens or activates the [Dump] window and displays the memory contents.
Register
Opens or activates the [Register] window and displays the register values.
Trace
Opens or activates the [Trace] window and displays the trace data.
Coverage
Opens or activates the [Coverage] window and displays the coverage
information.
Symbol
Opens or activates the [Symbol] window and displays the symbol information.
Watch
Opens or activates the [Watch] window and displays the symbol value.
Toolbar
Shows or hides the toolbar.
Status Bar
Shows or hides the status bar.
[Trace] menu
[Coverage] menu
[View] menu
[Option] menu
Содержание S1C88 Series
Страница 4: ......
Страница 304: ......
Страница 305: ...S1C88 Family Development Tools Quick Reference ...


